Chrysler 2008 Annual Report Download - page 41
Download and view the complete annual report
Please find page 41 of the 2008 Chrysler annual report below. You can navigate through the pages in the report by either clicking on the pages listed below, or by using the keyword search tool below to find specific information within the annual report.-
 1
1 -
2
-
3
-
4
-
5
-
6
-
7
-
8
-
9
-
10
-
11
-
12
-
13
-
14
-
15
-
16
-
17
-
18
-
19
-
20
-
21
-
22
-
23
-
24
-
25
-
26
-
27
-
28
-
29
-
30
-
 31
31 -
 32
32 -
 33
33 -
 34
34 -
 35
35 -
 36
36 -
 37
37 -
 38
38 -
 39
39 -
 40
40 -
 41
41 -
 42
42 -
 43
43 -
 44
44 -
 45
45 -
 46
46 -
 47
47 -
 48
48 -
 49
49 -
 50
50 -
 51
51 -
52
-
53
-
54
-
55
-
56
-
57
-
58
-
59
-
60
-
61
-
62
-
63
-
64
-
65
-
66
-
67
-
68
-
69
-
70
-
71
-
72
-
73
-
74
-
75
-
76
-
77
-
78
-
79
-
80
-
81
-
82
-
83
-
84
-
85
-
86
-
87
-
88
-
89
-
90
-
91
-
92
-
93
-
94
-
95
-
96
-
97
-
98
-
99
-
100
-
101
-
102
-
103
-
104
-
105
-
106
-
107
-
108
-
109
-
110
-
111
-
112
-
113
-
114
-
115
-
116
-
117
-
118
-
119
-
120
-
121
-
122
-
123
-
124
-
125
-
126
-
127
-
128
-
129
-
130
-
131
-
132
-
133
-
134
-
135
-
136
-
137
-
138
-
139
-
140
-
141
-
142
-
143
-
144
-
145
-
146
-
147
-
148
-
149
-
150
-
151
-
152
-
153
-
154
-
155
-
156
-
157
-
158
-
159
-
160
-
161
-
162
-
163
-
164
-
165
-
166
-
167
-
168
-
169
-
170
-
171
-
172
-
173
-
174
-
175
-
176
-
177
-
178
-
179
-
180
-
181
-
182
-
183
-
184
-
185
-
186
-
187
-
188
-
189
-
190
-
191
-
192
-
193
-
194
-
195
-
196
-
197
-
198
-
199
-
200
-
201
-
202
-
203
-
204
-
205
-
206
-
207
-
208
-
209
-
210
-
211
-
212
-
213
-
214
-
215
-
216
-
217
-
218
-
219
-
220
-
221
-
222
-
223
-
224
-
225
-
226
-
227
-
228
-
229
-
230
-
231
-
232
-
233
-
234
-
235
-
236
-
237
-
238
-
239
-
240
-
241
-
242
-
243
-
244
-
245
-
246
-
247
-
248
-
249
-
250
-
251
-
252
-
253
-
254
-
255
-
256
-
257
-
258
-
259
-
260
-
261
-
262
-
263
-
264
-
265
-
266
-
267
-
268
-
269
-
270
-
271
-
272
-
273
-
274
-
275
-
276
-
277
-
278
-
279
-
280
-
281
-
282
-
283
-
284
-
285
-
286
-
287
-
288
-
289
-
290
-
291
-
292
-
293
-
294
-
295
-
296
-
297
-
298
-
299
-
300
-
301
-
302
-
303
-
304
-
305
-
306
-
307
-
308
-
309
-
310
-
311
-
312
-
313
-
314
-
315
-
316
-
317
-
318
-
319
-
320
-
321
-
322
-
323
-
324
-
325
-
326
-
327
-
328
-
329
-
330
-
331
-
332
-
333
-
334
-
335
-
336
-
337
-
338
-
339
-
340
-
341
-
342
-
343
-
344
-
345
-
346
-
347
-
348
-
349
-
350
-
351
-
352
-
353
-
354
-
355
-
356
 |
 |
Report on Operations Financial Review – Fiat Group40
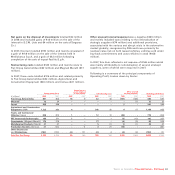
FPT Powertrain Technologies reported €7,000 million in
revenues (down 1.1% over 2007). Positive performance in the
first half (+15.3%) was reversed by the sharp contraction in the
closing months of 2008. Sales to external customers and joint
ventures accounted for 22% of the total (24% for 2007).
Revenues for Passenger & Commercial Vehicles totalled €3,650
million (6.2% down on 2007), of which 83% was from sales to
other Group companies with the remainder mainly
representing sales of diesel engines to external customers. A
total of 2,353,000 engines were sold during the year, reflecting
a 9.4% decrease. Deliveries of transmissions totalled 2,019,000,
down 3.5% over the previous year.
Revenues for the Industrial & Marine (I&M) product line totalled
€3,358 million. The 6.1% increase over 2007 was driven by an
increase in volumes to CNH and Sevel (the JV in light
commercial vehicles). Sales to other Group companies accounted
for approximately 73% of the total (74% for 2007). Engine sales
totalled 545,000 units, up 8%, primarily to Iveco (accounting for
40%), CNH (24%) and Sevel (25%). In addition, 106,000
transmissions (-14.1%) and 272,000 axles (-9.2%) were sold.
Magneti Marelli reported €5,447 million in revenues for 2008
(+8.9% over 2007), including €451 million in revenues from the
Plastic Components and Modules business line which has been
part of the Sector since the second quarter of 2008.
Assuming a constant scope of operations, revenues remained
substantially unchanged. Positive performance for the first half
of 2008 was, however, eroded by the drop in volumes
experienced in the fourth quarter reflecting the major impact of
the current market crisis. The drop in revenues was
experienced in all of the Sector’s activities, with the exception
of the favourable performance in Poland, attributable to the
Fiat 500, sales to certain external customers and strong
performance in Brazil, where the market recorded a year-on-
year increase, despite the contraction in the last few months.
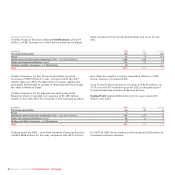
Teksid reported revenues of €837 million for 2008, up 6.9%
year-over-year. Excluding the effects of disposal of the
Magnesium business unit in early March 2007 and
consolidation of the Aluminium business unit as of September
2007, revenues increased 3% over 2007. The increase was
attributable to price increases introduced to offset higher raw
material costs which was partly compensated by lower
volumes for Cast Iron operations in Europe.
Comau had revenues of €1,123 million, a 3.1% increase over
2007 attributable to gains for the Body Welding business in
Europe and Service activities in Latin America, partly offset by
a decrease in Service activities in Europe, in line with the
reshaping of the Sector’s activities.
Other Businesses
Other Businesses includes the contribution from the Group’s
publishing businesses, service companies and holding
companies. Other Businesses had revenues of €1,394 million
for 2008, in line with the previous year.
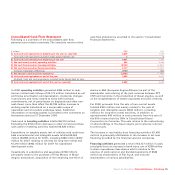
Trading Profit
Group trading profit was €3,362 million for 2008, up 4% over
2007, and the trading margin rose to 5.7% from 5.5% with a
strong contribution from CNH and improved trading
performance at Iveco more than offsetting margin declines in
other Sectors.