Chrysler 2008 Annual Report Download - page 184
Download and view the complete annual report
Please find page 184 of the 2008 Chrysler annual report below. You can navigate through the pages in the report by either clicking on the pages listed below, or by using the keyword search tool below to find specific information within the annual report.-
 1
1 -
2
-
3
-
4
-
5
-
6
-
7
-
8
-
9
-
10
-
11
-
12
-
13
-
14
-
15
-
16
-
17
-
18
-
19
-
20
-
21
-
22
-
23
-
24
-
25
-
26
-
27
-
28
-
29
-
30
-
31
-
32
-
33
-
34
-
35
-
36
-
37
-
38
-
39
-
40
-
41
-
42
-
43
-
44
-
45
-
46
-
47
-
48
-
49
-
50
-
51
-
52
-
53
-
54
-
55
-
56
-
57
-
58
-
59
-
60
-
61
-
62
-
63
-
64
-
65
-
66
-
67
-
68
-
69
-
70
-
71
-
72
-
73
-
74
-
75
-
76
-
77
-
78
-
79
-
80
-
81
-
82
-
83
-
84
-
85
-
86
-
87
-
88
-
89
-
90
-
91
-
92
-
93
-
94
-
95
-
96
-
97
-
98
-
99
-
100
-
101
-
102
-
103
-
104
-
105
-
106
-
107
-
108
-
109
-
110
-
111
-
112
-
113
-
114
-
115
-
116
-
117
-
118
-
119
-
120
-
121
-
122
-
123
-
124
-
125
-
126
-
127
-
128
-
129
-
130
-
131
-
132
-
133
-
134
-
135
-
136
-
137
-
138
-
139
-
140
-
141
-
142
-
143
-
144
-
145
-
146
-
147
-
148
-
149
-
150
-
151
-
152
-
153
-
154
-
155
-
156
-
157
-
158
-
159
-
160
-
161
-
162
-
163
-
164
-
165
-
166
-
167
-
168
-
169
-
170
-
171
-
172
-
173
-
 174
174 -
 175
175 -
 176
176 -
 177
177 -
 178
178 -
 179
179 -
 180
180 -
 181
181 -
 182
182 -
 183
183 -
 184
184 -
 185
185 -
 186
186 -
 187
187 -
 188
188 -
 189
189 -
 190
190 -
 191
191 -
 192
192 -
 193
193 -
 194
194 -
195
-
196
-
197
-
198
-
199
-
200
-
201
-
202
-
203
-
204
-
205
-
206
-
207
-
208
-
209
-
210
-
211
-
212
-
213
-
214
-
215
-
216
-
217
-
218
-
219
-
220
-
221
-
222
-
223
-
224
-
225
-
226
-
227
-
228
-
229
-
230
-
231
-
232
-
233
-
234
-
235
-
236
-
237
-
238
-
239
-
240
-
241
-
242
-
243
-
244
-
245
-
246
-
247
-
248
-
249
-
250
-
251
-
252
-
253
-
254
-
255
-
256
-
257
-
258
-
259
-
260
-
261
-
262
-
263
-
264
-
265
-
266
-
267
-
268
-
269
-
270
-
271
-
272
-
273
-
274
-
275
-
276
-
277
-
278
-
279
-
280
-
281
-
282
-
283
-
284
-
285
-
286
-
287
-
288
-
289
-
290
-
291
-
292
-
293
-
294
-
295
-
296
-
297
-
298
-
299
-
300
-
301
-
302
-
303
-
304
-
305
-
306
-
307
-
308
-
309
-
310
-
311
-
312
-
313
-
314
-
315
-
316
-
317
-
318
-
319
-
320
-
321
-
322
-
323
-
324
-
325
-
326
-
327
-
328
-
329
-
330
-
331
-
332
-
333
-
334
-
335
-
336
-
337
-
338
-
339
-
340
-
341
-
342
-
343
-
344
-
345
-
346
-
347
-
348
-
349
-
350
-
351
-
352
-
353
-
354
-
355
-
356
 |
 |

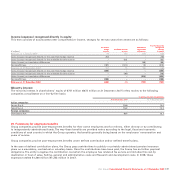
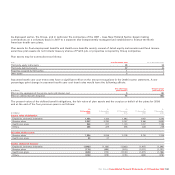
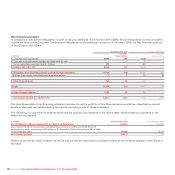
As discussed earlier, the Group, and in particular the companies of the CNH – Case New Holland Sector, began making
contributions on a voluntary basis in 2007 to a separate and independently managed fund established to finance the North
American health care plans.
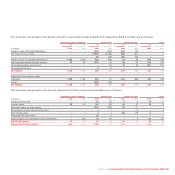
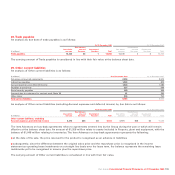
Plan assets for Post-employment benefits and Health-care benefits mainly consist of listed equity instruments and fixed income
securities; plan assets do not include treasury shares of Fiat S.p.A. or properties occupied by Group companies.
Plan assets may be summarised as follows:
In % At 31 December 2008 At 31 December 2007
Third party equity instruments 35 58
Third party debt instruments 57 39
Properties occupied by third parties 11
Other assets 72
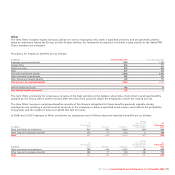
Assumed health care cost trend rates have a significant effect on the amount recognised in the 2008 income statement. A one
percentage point change in assumed health care cost trend rates would have the following effects:
One percentage One percentage
(€ millions) point increase point decrease
Effect on the aggregate of the service costs and interest cost 5(4)
Effect on defined benefit obligation 75 (64)
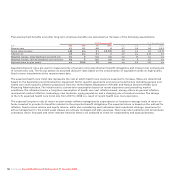
The present value of the defined benefit obligations, the fair value of plan assets and the surplus or deficit of the plans for 2008
and at the end of the four previous years is as follows:
At At At At At
31 December 31 December 31 December 31 December 31 December
(€ millions) 2008 2007 2006 2005 2004
Present value of obligation:
- Employee severance indemnity 1,062 1,133 1,362 1,417 1,243
- Pension plans 2,267 2,730 3,107 3,186 2,830
- Health care plans 848 817 1,109 1,417 1,186
-Others 288 279 278 323 278
Fair value of plan assets
- Pension plans 1,554 2,036 2,176 2,115 1,709
- Health care plans 39 47 – – –
Surplus (deficit) of the plan:
- Employee severance indemnity (1,062) (1,133) (1,362) (1,417) (1,243)
- Pension plans (713) (694) (931) (1,071) (1,121)
- Health care plans (809) (770) (1,109) (1,417) (1,186)
-Others (288) (279) (278) (323) (278)
Fiat Group Consolidated Financial Statements at 31 December 2008 183