Chrysler 2008 Annual Report Download - page 198
Download and view the complete annual report
Please find page 198 of the 2008 Chrysler annual report below. You can navigate through the pages in the report by either clicking on the pages listed below, or by using the keyword search tool below to find specific information within the annual report.-
 1
1 -
2
-
3
-
4
-
5
-
6
-
7
-
8
-
9
-
10
-
11
-
12
-
13
-
14
-
15
-
16
-
17
-
18
-
19
-
20
-
21
-
22
-
23
-
24
-
25
-
26
-
27
-
28
-
29
-
30
-
31
-
32
-
33
-
34
-
35
-
36
-
37
-
38
-
39
-
40
-
41
-
42
-
43
-
44
-
45
-
46
-
47
-
48
-
49
-
50
-
51
-
52
-
53
-
54
-
55
-
56
-
57
-
58
-
59
-
60
-
61
-
62
-
63
-
64
-
65
-
66
-
67
-
68
-
69
-
70
-
71
-
72
-
73
-
74
-
75
-
76
-
77
-
78
-
79
-
80
-
81
-
82
-
83
-
84
-
85
-
86
-
87
-
88
-
89
-
90
-
91
-
92
-
93
-
94
-
95
-
96
-
97
-
98
-
99
-
100
-
101
-
102
-
103
-
104
-
105
-
106
-
107
-
108
-
109
-
110
-
111
-
112
-
113
-
114
-
115
-
116
-
117
-
118
-
119
-
120
-
121
-
122
-
123
-
124
-
125
-
126
-
127
-
128
-
129
-
130
-
131
-
132
-
133
-
134
-
135
-
136
-
137
-
138
-
139
-
140
-
141
-
142
-
143
-
144
-
145
-
146
-
147
-
148
-
149
-
150
-
151
-
152
-
153
-
154
-
155
-
156
-
157
-
158
-
159
-
160
-
161
-
162
-
163
-
164
-
165
-
166
-
167
-
168
-
169
-
170
-
171
-
172
-
173
-
174
-
175
-
176
-
177
-
178
-
179
-
180
-
181
-
182
-
183
-
184
-
185
-
186
-
187
-
 188
188 -
 189
189 -
 190
190 -
 191
191 -
 192
192 -
 193
193 -
 194
194 -
 195
195 -
 196
196 -
 197
197 -
 198
198 -
 199
199 -
 200
200 -
 201
201 -
 202
202 -
 203
203 -
 204
204 -
 205
205 -
 206
206 -
 207
207 -
 208
208 -
209
-
210
-
211
-
212
-
213
-
214
-
215
-
216
-
217
-
218
-
219
-
220
-
221
-
222
-
223
-
224
-
225
-
226
-
227
-
228
-
229
-
230
-
231
-
232
-
233
-
234
-
235
-
236
-
237
-
238
-
239
-
240
-
241
-
242
-
243
-
244
-
245
-
246
-
247
-
248
-
249
-
250
-
251
-
252
-
253
-
254
-
255
-
256
-
257
-
258
-
259
-
260
-
261
-
262
-
263
-
264
-
265
-
266
-
267
-
268
-
269
-
270
-
271
-
272
-
273
-
274
-
275
-
276
-
277
-
278
-
279
-
280
-
281
-
282
-
283
-
284
-
285
-
286
-
287
-
288
-
289
-
290
-
291
-
292
-
293
-
294
-
295
-
296
-
297
-
298
-
299
-
300
-
301
-
302
-
303
-
304
-
305
-
306
-
307
-
308
-
309
-
310
-
311
-
312
-
313
-
314
-
315
-
316
-
317
-
318
-
319
-
320
-
321
-
322
-
323
-
324
-
325
-
326
-
327
-
328
-
329
-
330
-
331
-
332
-
333
-
334
-
335
-
336
-
337
-
338
-
339
-
340
-
341
-
342
-
343
-
344
-
345
-
346
-
347
-
348
-
349
-
350
-
351
-
352
-
353
-
354
-
355
-
356
 |
 |

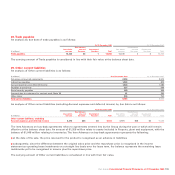
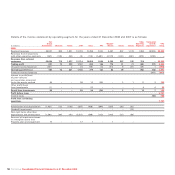
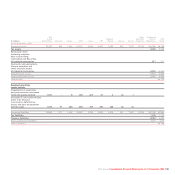
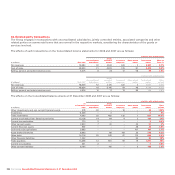
Fiat Other Unallocated
Group Magneti Operating items & FIAT
(€ millions) Automobiles Maserati Ferrari CNH Iveco FPT Marelli Teksid Comau Segments adjustments Group
2007
Segment revenues 26,812 694 1,668 11,843 11,196 7,075 5,000 783 1,089 1,374 (9,005) 58,529
Revenues from transactions
with other operating segments (303) (28) (84) (15) (93) (5,412) (1,829) (242) (374) (625) 9,005 –
Revenues from external
customers 26,509 666 1,584 11,828 11,103 1,663 3,171 541 715 749 – 58,529
Trading profit 803 24 266 990 813 271 214 47 (23) (110) (62) 3,233
Unusual income/(expense) (168) (2) – (37) (10) (14) (5) – (10) 189 (24) (81)
Operating profit/(loss) 635 22 266 953 803 257 209 47 (33) 79 (86) 3,152
Financial income/(expense) (564) (564)
Interest in profit/(loss)
of joint ventures
and associates accounted
for by the equity method 98 – 4 706113–26 1210
Other profit/(loss)
from investments (22)–––(6)––––4(1)(25)
Result from investments 76 – 4 70 – 1 1 3 – 30 – 185
Profit before taxes 2,773
Income taxes 719 719
Profit from continuing
operations 2,054
Amortisation and depreciation (1,338) (49) (129) (306) (421) (358) (209) (26) (23)
Goodwill impairment ––––––––(1)
Non-cash items other than
depreciation and amortisation (1,674) (72) (42) (1,720) (579) (68) (73) (15) (40)
Reversal of impairment losses
on Intangible assets and
Property, plan and equipment ––––3––––
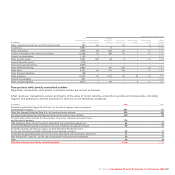
Segment assets are those assets employed by each segment in carrying out its usual activities or those which may be reasonably
allocated to it on the basis of its usual activities, including the value of investments in joint ventures and associates. Segment
liabilities are those liabilities arising directly from each segment’s usual activities or which may be reasonably allocated to it on the
basis of its usual activities. The Group’s treasury and tax activities are managed centrally and, therefore, are not allocated to the
individual segments as they are not directly related to operating activities. These assets and liabilities are not included under the
assets and liabilities attributed to the segments, but rather are reported under “Unallocated items and adjustments”. In particular,
treasury assets include amounts receivable from financing activities, other non-current receivables, securities other financial
assets, and cash and cash equivalents of the Group's industrial entities. Treasury liabilities, however, include debt and other
financial liabilities of the Group’s industrial entities, net of current financial receivables from jointly-controlled financial services
entities. As the segment net profit or loss includes Interest income and other financial income and Interest expense and other
financial expense of the financial services entities, the operating assets of Fiat Group Automobiles, Ferrari, CNH-Case New Holland
and Iveco also include the financial assets (predominantly the loan portfolio) of their financial services companies. Similarly,
liabilities for those segments include the debt of the financial services companies. Therefore, the unallocated Group debt
represents the debt of industrial entities only.
Fiat Group Consolidated Financial Statements at 31 December 2008 197