Chrysler 2008 Annual Report Download - page 254
Download and view the complete annual report
Please find page 254 of the 2008 Chrysler annual report below. You can navigate through the pages in the report by either clicking on the pages listed below, or by using the keyword search tool below to find specific information within the annual report.-
 1
1 -
2
-
3
-
4
-
5
-
6
-
7
-
8
-
9
-
10
-
11
-
12
-
13
-
14
-
15
-
16
-
17
-
18
-
19
-
20
-
21
-
22
-
23
-
24
-
25
-
26
-
27
-
28
-
29
-
30
-
31
-
32
-
33
-
34
-
35
-
36
-
37
-
38
-
39
-
40
-
41
-
42
-
43
-
44
-
45
-
46
-
47
-
48
-
49
-
50
-
51
-
52
-
53
-
54
-
55
-
56
-
57
-
58
-
59
-
60
-
61
-
62
-
63
-
64
-
65
-
66
-
67
-
68
-
69
-
70
-
71
-
72
-
73
-
74
-
75
-
76
-
77
-
78
-
79
-
80
-
81
-
82
-
83
-
84
-
85
-
86
-
87
-
88
-
89
-
90
-
91
-
92
-
93
-
94
-
95
-
96
-
97
-
98
-
99
-
100
-
101
-
102
-
103
-
104
-
105
-
106
-
107
-
108
-
109
-
110
-
111
-
112
-
113
-
114
-
115
-
116
-
117
-
118
-
119
-
120
-
121
-
122
-
123
-
124
-
125
-
126
-
127
-
128
-
129
-
130
-
131
-
132
-
133
-
134
-
135
-
136
-
137
-
138
-
139
-
140
-
141
-
142
-
143
-
144
-
145
-
146
-
147
-
148
-
149
-
150
-
151
-
152
-
153
-
154
-
155
-
156
-
157
-
158
-
159
-
160
-
161
-
162
-
163
-
164
-
165
-
166
-
167
-
168
-
169
-
170
-
171
-
172
-
173
-
174
-
175
-
176
-
177
-
178
-
179
-
180
-
181
-
182
-
183
-
184
-
185
-
186
-
187
-
188
-
189
-
190
-
191
-
192
-
193
-
194
-
195
-
196
-
197
-
198
-
199
-
200
-
201
-
202
-
203
-
204
-
205
-
206
-
207
-
208
-
209
-
210
-
211
-
212
-
213
-
214
-
215
-
216
-
217
-
218
-
219
-
220
-
221
-
222
-
223
-
224
-
225
-
226
-
227
-
228
-
229
-
230
-
231
-
232
-
233
-
234
-
235
-
236
-
237
-
238
-
239
-
240
-
241
-
242
-
243
-
 244
244 -
 245
245 -
 246
246 -
 247
247 -
 248
248 -
 249
249 -
 250
250 -
 251
251 -
 252
252 -
 253
253 -
 254
254 -
 255
255 -
 256
256 -
 257
257 -
 258
258 -
 259
259 -
 260
260 -
 261
261 -
 262
262 -
 263
263 -
 264
264 -
265
-
266
-
267
-
268
-
269
-
270
-
271
-
272
-
273
-
274
-
275
-
276
-
277
-
278
-
279
-
280
-
281
-
282
-
283
-
284
-
285
-
286
-
287
-
288
-
289
-
290
-
291
-
292
-
293
-
294
-
295
-
296
-
297
-
298
-
299
-
300
-
301
-
302
-
303
-
304
-
305
-
306
-
307
-
308
-
309
-
310
-
311
-
312
-
313
-
314
-
315
-
316
-
317
-
318
-
319
-
320
-
321
-
322
-
323
-
324
-
325
-
326
-
327
-
328
-
329
-
330
-
331
-
332
-
333
-
334
-
335
-
336
-
337
-
338
-
339
-
340
-
341
-
342
-
343
-
344
-
345
-
346
-
347
-
348
-
349
-
350
-
351
-
352
-
353
-
354
-
355
-
356
 |
 |

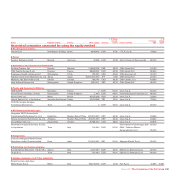
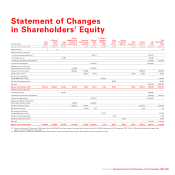
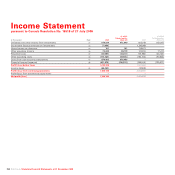
Balance Sheet (*)
(€) Note At 31 December 2008 At 31 December 2007
ASSETS
Non-current assets
Intangible assets (10) 375,027 811,118
Property, plant and equipment (11) 33,023,620 34,664,232
Investments (12) 14,444,736,795 13,311,484,271
Other financial assets (13) 20,637,109 19,493,464
Other non-current assets (14) 244,404 115,652
Deferred tax assets (9) ––
Total Non-current assets 14,499,016,955 13.366.568.737
Current assets
Inventories (26) ––
Trade receivables (15) 185,291,742 180,980,765
Current financial receivables (16) –1,223,431,224
Other current receivables (17) 905,058,254 892,160,645
Cash and cash equivalents (18) 494,707 523,747
Total Current assets 1,090,844,703 2,297,096,381
Assets held for sale ––
TOTAL ASSETS 15,589,861,658 15,663,665,118
SHAREHOLDERS’ EQUITY AND LIABILITIES
Shareholders’ equity (19)
Share capital 6,377,262,975 6,377,262,975
Additional paid-in capital 1,540,884,892 1,540,884,892
Legal reserve 639,502,863 536,059,918
Other reserves and retained profit 3,069,500,046 1,587,248,228
Treasury shares (656,553,154) (419,309,657)
Net profit 1,199,145,721 2,068,858,902
Total Shareholders’ equity 12,169,743,343 11,691,005,258
Non-current liabilities
Provisions for employee benefits and other non-current provisions (20) 26,418,516 21,301,993
Non-current financial payables (21) 1,810,531,500 2,809,388,000
Other non-current liabilities (22) 15,114,836 15,852,305
Deferred tax liabilities (9) 5,858,282 4,256,709
Total Non-current liabilities 1,857,923,134 2,850,799,007
Current liabilities
Provisions for employee benefits and other current provisions (23) 6,345,608 127,628
Trade payables (24) 218,235,215 246,495,446
Current financial payables (25) 553,132,702 294,695,310
Other payables (26) 784,481,656 580,542,469
Total Current liabilities 1,562,195,181 1,121,860,853
Liabilities held for sale ––
TOTAL SHAREHOLDERS’ EQUITY AND LIABILITIES 15,589,861,658 15,663,665,118
(*) Pursuant to Consob Resolution No. 15519 of 27 July 2006, the effects of transactions with related parties on the Balance Sheet of Fiat S.p.A. are presented in a specific balance sheet provided on the
following pages and in the comments on the single items and in Note 29.
Fiat S.p.A. Statutory Financial Statements at 31 December 2008 253