Chrysler 2008 Annual Report Download - page 56
Download and view the complete annual report
Please find page 56 of the 2008 Chrysler annual report below. You can navigate through the pages in the report by either clicking on the pages listed below, or by using the keyword search tool below to find specific information within the annual report.-
 1
1 -
2
-
3
-
4
-
5
-
6
-
7
-
8
-
9
-
10
-
11
-
12
-
13
-
14
-
15
-
16
-
17
-
18
-
19
-
20
-
21
-
22
-
23
-
24
-
25
-
26
-
27
-
28
-
29
-
30
-
31
-
32
-
33
-
34
-
35
-
36
-
37
-
38
-
39
-
40
-
41
-
42
-
43
-
44
-
45
-
 46
46 -
 47
47 -
 48
48 -
 49
49 -
 50
50 -
 51
51 -
 52
52 -
 53
53 -
 54
54 -
 55
55 -
 56
56 -
 57
57 -
 58
58 -
 59
59 -
 60
60 -
 61
61 -
 62
62 -
 63
63 -
 64
64 -
 65
65 -
 66
66 -
67
-
68
-
69
-
70
-
71
-
72
-
73
-
74
-
75
-
76
-
77
-
78
-
79
-
80
-
81
-
82
-
83
-
84
-
85
-
86
-
87
-
88
-
89
-
90
-
91
-
92
-
93
-
94
-
95
-
96
-
97
-
98
-
99
-
100
-
101
-
102
-
103
-
104
-
105
-
106
-
107
-
108
-
109
-
110
-
111
-
112
-
113
-
114
-
115
-
116
-
117
-
118
-
119
-
120
-
121
-
122
-
123
-
124
-
125
-
126
-
127
-
128
-
129
-
130
-
131
-
132
-
133
-
134
-
135
-
136
-
137
-
138
-
139
-
140
-
141
-
142
-
143
-
144
-
145
-
146
-
147
-
148
-
149
-
150
-
151
-
152
-
153
-
154
-
155
-
156
-
157
-
158
-
159
-
160
-
161
-
162
-
163
-
164
-
165
-
166
-
167
-
168
-
169
-
170
-
171
-
172
-
173
-
174
-
175
-
176
-
177
-
178
-
179
-
180
-
181
-
182
-
183
-
184
-
185
-
186
-
187
-
188
-
189
-
190
-
191
-
192
-
193
-
194
-
195
-
196
-
197
-
198
-
199
-
200
-
201
-
202
-
203
-
204
-
205
-
206
-
207
-
208
-
209
-
210
-
211
-
212
-
213
-
214
-
215
-
216
-
217
-
218
-
219
-
220
-
221
-
222
-
223
-
224
-
225
-
226
-
227
-
228
-
229
-
230
-
231
-
232
-
233
-
234
-
235
-
236
-
237
-
238
-
239
-
240
-
241
-
242
-
243
-
244
-
245
-
246
-
247
-
248
-
249
-
250
-
251
-
252
-
253
-
254
-
255
-
256
-
257
-
258
-
259
-
260
-
261
-
262
-
263
-
264
-
265
-
266
-
267
-
268
-
269
-
270
-
271
-
272
-
273
-
274
-
275
-
276
-
277
-
278
-
279
-
280
-
281
-
282
-
283
-
284
-
285
-
286
-
287
-
288
-
289
-
290
-
291
-
292
-
293
-
294
-
295
-
296
-
297
-
298
-
299
-
300
-
301
-
302
-
303
-
304
-
305
-
306
-
307
-
308
-
309
-
310
-
311
-
312
-
313
-
314
-
315
-
316
-
317
-
318
-
319
-
320
-
321
-
322
-
323
-
324
-
325
-
326
-
327
-
328
-
329
-
330
-
331
-
332
-
333
-
334
-
335
-
336
-
337
-
338
-
339
-
340
-
341
-
342
-
343
-
344
-
345
-
346
-
347
-
348
-
349
-
350
-
351
-
352
-
353
-
354
-
355
-
356
 |
 |
Report on Operations Financial Review – Fiat Group 55
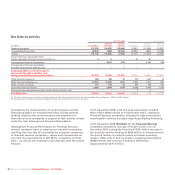
Industrial Activities
For 2008, Industrial Activities absorbed cash and cash
equivalents totalling €2.9 billion. In particular:
Operating activities generated a net cash inflow of €156
million. Cash generated by income related cash inflows (net
profit plus amortisation and depreciation) - net of
gains/(losses) on disposal and other non-cash items, changes
in provisions, deferred taxes, items relating to the sale of
vehicles under buy-back commitments and dividends received -
was almost entirely offset by the increase in working capital
which, on a comparable scope of operations and at constant
exchange rates, amounted to €3,604 million.
Investing activities absorbed a total of €6,088 million in cash,
essentially for investments (€5,132 million including
unconsolidated subsidiaries and other investments) and the
increase in funding provided to the Group’s financial services
companies by central treasury companies (included under
Other Changes).
Financing activities generated cash of €3,070 million.
Increased use of external funding provided €3,840 million of
additional liquidity. Additionally, during the year, the Group
utilised cash for share buy-backs (€238 million, net of shares
sold in relation to the exercise of stock options) and dividend
payments (€546 million).
Financial Services
Cash and cash equivalents for Financial Services activities
totalled €1,079 million at 31 December 2008, down €14 million
over 31 December 2007.
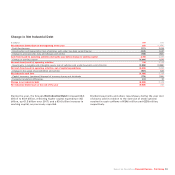
Changes in cash during the year were attributable to:
Operating activities, which generated €268 million in cash,
principally from income related cash inflows (net income plus
amortisation and depreciation).
Investing activities (including changes in financial
receivables from/payables to Group industrial companies),
which absorbed €226 million in cash. In particular, funding
requirements related to the increase in the receivable portfolio
(€1,503 million) and capital expenditure (€283 million),
principally for vehicles leased out under operating leases,
more than offset cash from financing provided by the Group’s
treasury companies (included under Industrial Activities) to
meet that requirement (classified under Other Changes), the
decrease in Other Current Securities and Proceeds from the
Sale of Non-Current Assets (principally vehicles leased out
under operating leases).
Financing activities, which generated cash of €21 million.