Chrysler 2008 Annual Report Download - page 196
Download and view the complete annual report
Please find page 196 of the 2008 Chrysler annual report below. You can navigate through the pages in the report by either clicking on the pages listed below, or by using the keyword search tool below to find specific information within the annual report.-
 1
1 -
2
-
3
-
4
-
5
-
6
-
7
-
8
-
9
-
10
-
11
-
12
-
13
-
14
-
15
-
16
-
17
-
18
-
19
-
20
-
21
-
22
-
23
-
24
-
25
-
26
-
27
-
28
-
29
-
30
-
31
-
32
-
33
-
34
-
35
-
36
-
37
-
38
-
39
-
40
-
41
-
42
-
43
-
44
-
45
-
46
-
47
-
48
-
49
-
50
-
51
-
52
-
53
-
54
-
55
-
56
-
57
-
58
-
59
-
60
-
61
-
62
-
63
-
64
-
65
-
66
-
67
-
68
-
69
-
70
-
71
-
72
-
73
-
74
-
75
-
76
-
77
-
78
-
79
-
80
-
81
-
82
-
83
-
84
-
85
-
86
-
87
-
88
-
89
-
90
-
91
-
92
-
93
-
94
-
95
-
96
-
97
-
98
-
99
-
100
-
101
-
102
-
103
-
104
-
105
-
106
-
107
-
108
-
109
-
110
-
111
-
112
-
113
-
114
-
115
-
116
-
117
-
118
-
119
-
120
-
121
-
122
-
123
-
124
-
125
-
126
-
127
-
128
-
129
-
130
-
131
-
132
-
133
-
134
-
135
-
136
-
137
-
138
-
139
-
140
-
141
-
142
-
143
-
144
-
145
-
146
-
147
-
148
-
149
-
150
-
151
-
152
-
153
-
154
-
155
-
156
-
157
-
158
-
159
-
160
-
161
-
162
-
163
-
164
-
165
-
166
-
167
-
168
-
169
-
170
-
171
-
172
-
173
-
174
-
175
-
176
-
177
-
178
-
179
-
180
-
181
-
182
-
183
-
184
-
185
-
 186
186 -
 187
187 -
 188
188 -
 189
189 -
 190
190 -
 191
191 -
 192
192 -
 193
193 -
 194
194 -
 195
195 -
 196
196 -
 197
197 -
 198
198 -
 199
199 -
 200
200 -
 201
201 -
 202
202 -
 203
203 -
 204
204 -
 205
205 -
 206
206 -
207
-
208
-
209
-
210
-
211
-
212
-
213
-
214
-
215
-
216
-
217
-
218
-
219
-
220
-
221
-
222
-
223
-
224
-
225
-
226
-
227
-
228
-
229
-
230
-
231
-
232
-
233
-
234
-
235
-
236
-
237
-
238
-
239
-
240
-
241
-
242
-
243
-
244
-
245
-
246
-
247
-
248
-
249
-
250
-
251
-
252
-
253
-
254
-
255
-
256
-
257
-
258
-
259
-
260
-
261
-
262
-
263
-
264
-
265
-
266
-
267
-
268
-
269
-
270
-
271
-
272
-
273
-
274
-
275
-
276
-
277
-
278
-
279
-
280
-
281
-
282
-
283
-
284
-
285
-
286
-
287
-
288
-
289
-
290
-
291
-
292
-
293
-
294
-
295
-
296
-
297
-
298
-
299
-
300
-
301
-
302
-
303
-
304
-
305
-
306
-
307
-
308
-
309
-
310
-
311
-
312
-
313
-
314
-
315
-
316
-
317
-
318
-
319
-
320
-
321
-
322
-
323
-
324
-
325
-
326
-
327
-
328
-
329
-
330
-
331
-
332
-
333
-
334
-
335
-
336
-
337
-
338
-
339
-
340
-
341
-
342
-
343
-
344
-
345
-
346
-
347
-
348
-
349
-
350
-
351
-
352
-
353
-
354
-
355
-
356
 |
 |
The Components segment (Magneti Marelli) derives its revenues from the production and sale of lighting components, engine
control units, suspensions, shock absorbers, electronic systems, exhaust systems and plastic moulding components activities and
After Market.
The Metallurgical Products segment (Teksid) derives its revenues from the production and sale of cast iron components for
engines, transmissions and suspension systems, and aluminium cylinder heads.
The Production System segment (Comau) derives its revenues from the design and production of industrial automation systems
and related products for the automotive sector.
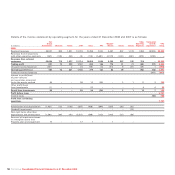
The Group assesses performance of its operating segments on the basis of Trading profit, Operating profit and Result from
investments made by those segments.
Revenues for each reported segment are those directly generated by or attributable to the segment as a result of its usual business
activities and include revenues from transactions with third parties as well as those derived from transactions with other
segments, recognised at normal market prices. For those operating segments which also carry out financial services activities,
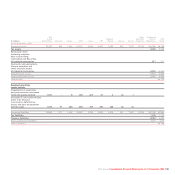
revenues include interest income and other financial income derived from those activities. Segment expenses represent expenses
derived from each segment's business activities both with third parties and other operating segments or which may otherwise be
directly attributable to it. Expenses derived from business activities with other segments are recognised at normal market prices.
For those operating segments which also carry out financial services activities, expenses include interest expense and other
financial expense derived from those activities.
The measure used to assess profit and loss for each operating segment is the Operating profit/(loss). Trading Profit is reported as a
specific part of the Operating profit/(loss) to separate the income and expense that is non-recurring in the ordinary operations
of the business, such as gains and losses from the disposals of equity investments or restructuring costs from profit or loss
attributable to the Segments. Financial income and expense and taxes not derived from operating activities are recognised
centrally and reported under Unallocated items and adjustments.
All profit and loss items reported are recognised in accordance with the same accounting principles adopted for preparation of the
Group’s Consolidated financial statements.
Fiat Group Consolidated Financial Statements at 31 December 2008 195