Chrysler 2008 Annual Report Download - page 108
Download and view the complete annual report
Please find page 108 of the 2008 Chrysler annual report below. You can navigate through the pages in the report by either clicking on the pages listed below, or by using the keyword search tool below to find specific information within the annual report.-
 1
1 -
2
-
3
-
4
-
5
-
6
-
7
-
8
-
9
-
10
-
11
-
12
-
13
-
14
-
15
-
16
-
17
-
18
-
19
-
20
-
21
-
22
-
23
-
24
-
25
-
26
-
27
-
28
-
29
-
30
-
31
-
32
-
33
-
34
-
35
-
36
-
37
-
38
-
39
-
40
-
41
-
42
-
43
-
44
-
45
-
46
-
47
-
48
-
49
-
50
-
51
-
52
-
53
-
54
-
55
-
56
-
57
-
58
-
59
-
60
-
61
-
62
-
63
-
64
-
65
-
66
-
67
-
68
-
69
-
70
-
71
-
72
-
73
-
74
-
75
-
76
-
77
-
78
-
79
-
80
-
81
-
82
-
83
-
84
-
85
-
86
-
87
-
88
-
89
-
90
-
91
-
92
-
93
-
94
-
95
-
96
-
97
-
 98
98 -
 99
99 -
 100
100 -
 101
101 -
 102
102 -
 103
103 -
 104
104 -
 105
105 -
 106
106 -
 107
107 -
 108
108 -
 109
109 -
 110
110 -
 111
111 -
 112
112 -
 113
113 -
 114
114 -
 115
115 -
 116
116 -
 117
117 -
 118
118 -
119
-
120
-
121
-
122
-
123
-
124
-
125
-
126
-
127
-
128
-
129
-
130
-
131
-
132
-
133
-
134
-
135
-
136
-
137
-
138
-
139
-
140
-
141
-
142
-
143
-
144
-
145
-
146
-
147
-
148
-
149
-
150
-
151
-
152
-
153
-
154
-
155
-
156
-
157
-
158
-
159
-
160
-
161
-
162
-
163
-
164
-
165
-
166
-
167
-
168
-
169
-
170
-
171
-
172
-
173
-
174
-
175
-
176
-
177
-
178
-
179
-
180
-
181
-
182
-
183
-
184
-
185
-
186
-
187
-
188
-
189
-
190
-
191
-
192
-
193
-
194
-
195
-
196
-
197
-
198
-
199
-
200
-
201
-
202
-
203
-
204
-
205
-
206
-
207
-
208
-
209
-
210
-
211
-
212
-
213
-
214
-
215
-
216
-
217
-
218
-
219
-
220
-
221
-
222
-
223
-
224
-
225
-
226
-
227
-
228
-
229
-
230
-
231
-
232
-
233
-
234
-
235
-
236
-
237
-
238
-
239
-
240
-
241
-
242
-
243
-
244
-
245
-
246
-
247
-
248
-
249
-
250
-
251
-
252
-
253
-
254
-
255
-
256
-
257
-
258
-
259
-
260
-
261
-
262
-
263
-
264
-
265
-
266
-
267
-
268
-
269
-
270
-
271
-
272
-
273
-
274
-
275
-
276
-
277
-
278
-
279
-
280
-
281
-
282
-
283
-
284
-
285
-
286
-
287
-
288
-
289
-
290
-
291
-
292
-
293
-
294
-
295
-
296
-
297
-
298
-
299
-
300
-
301
-
302
-
303
-
304
-
305
-
306
-
307
-
308
-
309
-
310
-
311
-
312
-
313
-
314
-
315
-
316
-
317
-
318
-
319
-
320
-
321
-
322
-
323
-
324
-
325
-
326
-
327
-
328
-
329
-
330
-
331
-
332
-
333
-
334
-
335
-
336
-
337
-
338
-
339
-
340
-
341
-
342
-
343
-
344
-
345
-
346
-
347
-
348
-
349
-
350
-
351
-
352
-
353
-
354
-
355
-
356
 |
 |

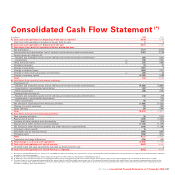
Consolidated Cash Flow Statement
pursuant to Consob Resolution No. 15519 of 27 July 2006
of which of which
Related Related
(€ millions) 2008 parties 2007 parties
A) Cash and cash equivalents at beginning of the year as reported 6,639 7,736
Cash and cash equivalents included as Assets held for sale 2–5–
B) Cash and cash equivalents at beginning of the year 6,641 7, 74 1
C) Cash flows from (used in) operating activities during the year:
Net profit/(loss) 1,721 – 2,054 –
Amortisation and depreciation (net of vehicles sold under buy-back commitments) 2,901 – 2,738 –
(Gains) losses on disposal of:
- Tangible and intangible assets (net of vehicles sold under buy-back commitments) (30) – (107) –
- Investments (20) – (190) –
Other non-cash items 253 7 (138) 40
Dividends received 84 84 81 81
Change in provisions (161) (3) 67
Change in deferred taxes (490) – (157) –
Change in items due to buy-back commitments (88) – 34 6
Change in working capital (3,786) (323) 1,588 152
Total 384 5,909
D) Cash flows from (used in) investment activities:
Investments in:
- Tangible and intangible assets (net of vehicles sold under buy-back commitments) (5,263) (12) (3,985) –
- Investments in consolidated subsidiaries (62) – (13) –
- Other investments (86) (82) (109) (86)
Proceeds from the sale of:
- Tangible and intangible assets (net of vehicles sold under buy-back commitments) 242 – 259 –
- Investments in consolidated subsidiaries ––225 97
- Other investments 58 – 251 –
Net change in receivables from financing activities (1,493) 106 (1,032) (23)
Change in current securities 118 – (63) –
Other changes 176 – (134) –
Total (6,310) (4,601)
E) Cash flows from (used in) financing activities:
New issuance of bonds 50 – 1,000 –
Repayment of bonds (225) – (1,053) –
Issuance of other medium-term borrowings 3,601 – 613 –
Repayment of other medium-term borrowings (1,136) – (1,129) –
Net change in other financial payables and other financial assets/liabilities 1,606 256 (1,106) (124)
Increase in share capital 15 – 5–
(Buy-back) sale of treasury shares (238) – (395) 3
Dividends paid (546) (146) (310) (61)
Total 3,127 (2,375)
Translation exchange differences (159) (33)
F) Total change in cash and cash equivalents (2,958) (1,100)
G) Cash and cash equivalents at end of the year 3,683 6,641
of which: Cash and cash equivalents included as Assets held for sale ––2–
H) Cash and cash equivalents at end of period as reported 3,683 6,639
Fiat Group Consolidated Financial Statements at 31 December 2008 107