Chrysler 2008 Annual Report Download - page 181
Download and view the complete annual report
Please find page 181 of the 2008 Chrysler annual report below. You can navigate through the pages in the report by either clicking on the pages listed below, or by using the keyword search tool below to find specific information within the annual report.-
 1
1 -
2
-
3
-
4
-
5
-
6
-
7
-
8
-
9
-
10
-
11
-
12
-
13
-
14
-
15
-
16
-
17
-
18
-
19
-
20
-
21
-
22
-
23
-
24
-
25
-
26
-
27
-
28
-
29
-
30
-
31
-
32
-
33
-
34
-
35
-
36
-
37
-
38
-
39
-
40
-
41
-
42
-
43
-
44
-
45
-
46
-
47
-
48
-
49
-
50
-
51
-
52
-
53
-
54
-
55
-
56
-
57
-
58
-
59
-
60
-
61
-
62
-
63
-
64
-
65
-
66
-
67
-
68
-
69
-
70
-
71
-
72
-
73
-
74
-
75
-
76
-
77
-
78
-
79
-
80
-
81
-
82
-
83
-
84
-
85
-
86
-
87
-
88
-
89
-
90
-
91
-
92
-
93
-
94
-
95
-
96
-
97
-
98
-
99
-
100
-
101
-
102
-
103
-
104
-
105
-
106
-
107
-
108
-
109
-
110
-
111
-
112
-
113
-
114
-
115
-
116
-
117
-
118
-
119
-
120
-
121
-
122
-
123
-
124
-
125
-
126
-
127
-
128
-
129
-
130
-
131
-
132
-
133
-
134
-
135
-
136
-
137
-
138
-
139
-
140
-
141
-
142
-
143
-
144
-
145
-
146
-
147
-
148
-
149
-
150
-
151
-
152
-
153
-
154
-
155
-
156
-
157
-
158
-
159
-
160
-
161
-
162
-
163
-
164
-
165
-
166
-
167
-
168
-
169
-
170
-
 171
171 -
 172
172 -
 173
173 -
 174
174 -
 175
175 -
 176
176 -
 177
177 -
 178
178 -
 179
179 -
 180
180 -
 181
181 -
 182
182 -
 183
183 -
 184
184 -
 185
185 -
 186
186 -
 187
187 -
 188
188 -
 189
189 -
 190
190 -
 191
191 -
192
-
193
-
194
-
195
-
196
-
197
-
198
-
199
-
200
-
201
-
202
-
203
-
204
-
205
-
206
-
207
-
208
-
209
-
210
-
211
-
212
-
213
-
214
-
215
-
216
-
217
-
218
-
219
-
220
-
221
-
222
-
223
-
224
-
225
-
226
-
227
-
228
-
229
-
230
-
231
-
232
-
233
-
234
-
235
-
236
-
237
-
238
-
239
-
240
-
241
-
242
-
243
-
244
-
245
-
246
-
247
-
248
-
249
-
250
-
251
-
252
-
253
-
254
-
255
-
256
-
257
-
258
-
259
-
260
-
261
-
262
-
263
-
264
-
265
-
266
-
267
-
268
-
269
-
270
-
271
-
272
-
273
-
274
-
275
-
276
-
277
-
278
-
279
-
280
-
281
-
282
-
283
-
284
-
285
-
286
-
287
-
288
-
289
-
290
-
291
-
292
-
293
-
294
-
295
-
296
-
297
-
298
-
299
-
300
-
301
-
302
-
303
-
304
-
305
-
306
-
307
-
308
-
309
-
310
-
311
-
312
-
313
-
314
-
315
-
316
-
317
-
318
-
319
-
320
-
321
-
322
-
323
-
324
-
325
-
326
-
327
-
328
-
329
-
330
-
331
-
332
-
333
-
334
-
335
-
336
-
337
-
338
-
339
-
340
-
341
-
342
-
343
-
344
-
345
-
346
-
347
-
348
-
349
-
350
-
351
-
352
-
353
-
354
-
355
-
356
 |
 |

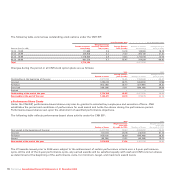
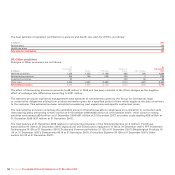
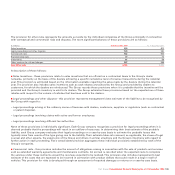
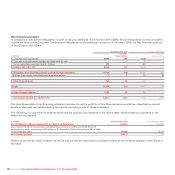
Post-employment benefits and other long-term employee benefits are calculated on the basis of the following assumptions:
At 31 December 2008 At 31 December 2007
In % Italy USA UK Other Italy USA UK Other
Discount rate 5.1 6.1 6.5 6 4.7 5.8 5.6 5-5.3
Future salary increase 4.65 n/a 3.1 2.5-3.75 4.6 n/a 4.0 0-3.75
Inflation rate 2.0 n/a 3.1 2 2.0 n/a 3.25 2.0
Weighted average, initial healthcare cost trend rate n/a 9 n/a n/a n/a 10 n/a n/a
Weighted average, ultimate healthcare cost trend rate n/a 5 n/a n/a n/a 5 n/a n/a
Expected return on plan assets n/a 7.75-8 7.0 n/a n/a 8.0 7.25 n/a
Assumed discount rates are used in measurements of pension and postretirement benefit obligations and interest cost components
of net periodic cost. The Group selects its assumed discount rates based on the consideration of equivalent yields on high-quality
fixed income investments at the measurement date.
The assumed health care trend rate represents the rate at which health care costs are assumed to increase. Rates are determined
based on the Agricultural and Construction equipment Sector specific experience and various trend factors including general and
health care sector-specific inflation projections from the United States Department of Health and Human Services Health Care
Financing Administration. The initial trend is a short-term assumption based on recent experience and prevailing market
conditions. The ultimate trend is a long-term assumption of health care cost inflation based, among others on general inflation,
incremental medical inflation, technology, new medicine, aging population and a changing mix of medical services. The change
in the U.S. assumed health care trend rate from 2007 to 2008 is a result of recent health care cost experience.
The expected long-term rate of return on plan assets reflects management’s expectations on long-term average rates of return on
funds invested to provide for benefits included in the projected benefit obligations. The expected return is based on the outlook for
inflation, fixed income returns and equity returns, while also considering asset allocation and investment strategy, premiums for
active management to the extent asset classes are actively managed and plan expenses. Historical return patterns and correlations,
consensus return forecasts and other relevant financial factors are analysed to check for reasonability and appropriateness.
Fiat Group Consolidated Financial Statements at 31 December 2008180