Chrysler 2008 Annual Report Download - page 12
Download and view the complete annual report
Please find page 12 of the 2008 Chrysler annual report below. You can navigate through the pages in the report by either clicking on the pages listed below, or by using the keyword search tool below to find specific information within the annual report.-
 1
1 -
 2
2 -
 3
3 -
 4
4 -
 5
5 -
 6
6 -
 7
7 -
 8
8 -
 9
9 -
 10
10 -
 11
11 -
 12
12 -
 13
13 -
 14
14 -
 15
15 -
 16
16 -
 17
17 -
 18
18 -
 19
19 -
 20
20 -
 21
21 -
 22
22 -
23
-
24
-
25
-
26
-
27
-
28
-
29
-
30
-
31
-
32
-
33
-
34
-
35
-
36
-
37
-
38
-
39
-
40
-
41
-
42
-
43
-
44
-
45
-
46
-
47
-
48
-
49
-
50
-
51
-
52
-
53
-
54
-
55
-
56
-
57
-
58
-
59
-
60
-
61
-
62
-
63
-
64
-
65
-
66
-
67
-
68
-
69
-
70
-
71
-
72
-
73
-
74
-
75
-
76
-
77
-
78
-
79
-
80
-
81
-
82
-
83
-
84
-
85
-
86
-
87
-
88
-
89
-
90
-
91
-
92
-
93
-
94
-
95
-
96
-
97
-
98
-
99
-
100
-
101
-
102
-
103
-
104
-
105
-
106
-
107
-
108
-
109
-
110
-
111
-
112
-
113
-
114
-
115
-
116
-
117
-
118
-
119
-
120
-
121
-
122
-
123
-
124
-
125
-
126
-
127
-
128
-
129
-
130
-
131
-
132
-
133
-
134
-
135
-
136
-
137
-
138
-
139
-
140
-
141
-
142
-
143
-
144
-
145
-
146
-
147
-
148
-
149
-
150
-
151
-
152
-
153
-
154
-
155
-
156
-
157
-
158
-
159
-
160
-
161
-
162
-
163
-
164
-
165
-
166
-
167
-
168
-
169
-
170
-
171
-
172
-
173
-
174
-
175
-
176
-
177
-
178
-
179
-
180
-
181
-
182
-
183
-
184
-
185
-
186
-
187
-
188
-
189
-
190
-
191
-
192
-
193
-
194
-
195
-
196
-
197
-
198
-
199
-
200
-
201
-
202
-
203
-
204
-
205
-
206
-
207
-
208
-
209
-
210
-
211
-
212
-
213
-
214
-
215
-
216
-
217
-
218
-
219
-
220
-
221
-
222
-
223
-
224
-
225
-
226
-
227
-
228
-
229
-
230
-
231
-
232
-
233
-
234
-
235
-
236
-
237
-
238
-
239
-
240
-
241
-
242
-
243
-
244
-
245
-
246
-
247
-
248
-
249
-
250
-
251
-
252
-
253
-
254
-
255
-
256
-
257
-
258
-
259
-
260
-
261
-
262
-
263
-
264
-
265
-
266
-
267
-
268
-
269
-
270
-
271
-
272
-
273
-
274
-
275
-
276
-
277
-
278
-
279
-
280
-
281
-
282
-
283
-
284
-
285
-
286
-
287
-
288
-
289
-
290
-
291
-
292
-
293
-
294
-
295
-
296
-
297
-
298
-
299
-
300
-
301
-
302
-
303
-
304
-
305
-
306
-
307
-
308
-
309
-
310
-
311
-
312
-
313
-
314
-
315
-
316
-
317
-
318
-
319
-
320
-
321
-
322
-
323
-
324
-
325
-
326
-
327
-
328
-
329
-
330
-
331
-
332
-
333
-
334
-
335
-
336
-
337
-
338
-
339
-
340
-
341
-
342
-
343
-
344
-
345
-
346
-
347
-
348
-
349
-
350
-
351
-
352
-
353
-
354
-
355
-
356
 |
 |

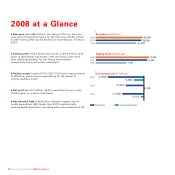
Report on Operations 2008 at a Glance 11
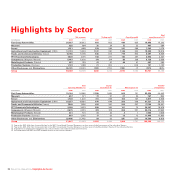
Highlights
(€ millions) 2008 2007 2006
Net revenues 59,380 58,529 51,832
Trading profit 3,362 3,233 1,951
Operating profit 2,972 3,152 2,061
Profit before taxes 2,187 2,773 1,641
Net profit for the year 1,721 2,054 1,151
Attributable to:
- shareholders of the parent company 1,612 1,953 1,065
- minority shareholders 109 101 86
Basic earnings per ordinary and preference share (€) (1) 1.290 1.537 0.789
Basic earnings per savings share (€) (1) 1.445 1.692 1.564
Diluted earnings per ordinary and preference share (€) (1) 1.285 1.526 0.788
Diluted earnings per savings share (€) (1) 1.440 1.681 1.563
Investments in tangible and intangible assets 5,263 3,985 3,789
of which, capitalised R&D costs 1,216 932 813
R&D expenditure (2) 1,986 1,741 1,591
Total assets 61,772 60,136 58,404
Net (debt)/cash (17,954) (10,423) (11,836)
of which: net industrial (debt)/cash (5,949) 355 (1,773)
Total shareholders’ equity 11,101 11,279 10,036
Equity attributable to shareholders of the parent company 10,354 10,606 9,362
Number of employees at the end of the year 198,348 185,227 172,012
(1) See Note 13 to the Consolidated Financial Statements for additional information on the calculation of basic and diluted earnings per share.
(2) Includes capitalised R&D and R&D charged directly to the income statement.
Select data by region
2008 2007 2008 2007 2008 2007 2008 2007 2008 2007
Italy 145 162 82,371 77,679 70 56 50 49 14,316 15,857
Europe (excluding Italy) 274 281 50,159 45,999 62 54 33 32 23,739 23,461
North America 70 74 12,305 11,364 19 22 15 14 5,653 5,842
Mercosur 33 32 43,042 39,324 27 24 10 10 9,975 8,318
Other regions 111 111 10,471 10,861 25 22 10 95,697 5,051
Total 633 660 198,348 185,227 203 178 118 114 59,380 58,529
Number of companies Employees Facilities R&D Centres
Revenues
by destination
(€ m)