Chrysler 2008 Annual Report Download - page 208
Download and view the complete annual report
Please find page 208 of the 2008 Chrysler annual report below. You can navigate through the pages in the report by either clicking on the pages listed below, or by using the keyword search tool below to find specific information within the annual report.-
 1
1 -
2
-
3
-
4
-
5
-
6
-
7
-
8
-
9
-
10
-
11
-
12
-
13
-
14
-
15
-
16
-
17
-
18
-
19
-
20
-
21
-
22
-
23
-
24
-
25
-
26
-
27
-
28
-
29
-
30
-
31
-
32
-
33
-
34
-
35
-
36
-
37
-
38
-
39
-
40
-
41
-
42
-
43
-
44
-
45
-
46
-
47
-
48
-
49
-
50
-
51
-
52
-
53
-
54
-
55
-
56
-
57
-
58
-
59
-
60
-
61
-
62
-
63
-
64
-
65
-
66
-
67
-
68
-
69
-
70
-
71
-
72
-
73
-
74
-
75
-
76
-
77
-
78
-
79
-
80
-
81
-
82
-
83
-
84
-
85
-
86
-
87
-
88
-
89
-
90
-
91
-
92
-
93
-
94
-
95
-
96
-
97
-
98
-
99
-
100
-
101
-
102
-
103
-
104
-
105
-
106
-
107
-
108
-
109
-
110
-
111
-
112
-
113
-
114
-
115
-
116
-
117
-
118
-
119
-
120
-
121
-
122
-
123
-
124
-
125
-
126
-
127
-
128
-
129
-
130
-
131
-
132
-
133
-
134
-
135
-
136
-
137
-
138
-
139
-
140
-
141
-
142
-
143
-
144
-
145
-
146
-
147
-
148
-
149
-
150
-
151
-
152
-
153
-
154
-
155
-
156
-
157
-
158
-
159
-
160
-
161
-
162
-
163
-
164
-
165
-
166
-
167
-
168
-
169
-
170
-
171
-
172
-
173
-
174
-
175
-
176
-
177
-
178
-
179
-
180
-
181
-
182
-
183
-
184
-
185
-
186
-
187
-
188
-
189
-
190
-
191
-
192
-
193
-
194
-
195
-
196
-
197
-
 198
198 -
 199
199 -
 200
200 -
 201
201 -
 202
202 -
 203
203 -
 204
204 -
 205
205 -
 206
206 -
 207
207 -
 208
208 -
 209
209 -
 210
210 -
 211
211 -
 212
212 -
 213
213 -
 214
214 -
 215
215 -
 216
216 -
 217
217 -
 218
218 -
219
-
220
-
221
-
222
-
223
-
224
-
225
-
226
-
227
-
228
-
229
-
230
-
231
-
232
-
233
-
234
-
235
-
236
-
237
-
238
-
239
-
240
-
241
-
242
-
243
-
244
-
245
-
246
-
247
-
248
-
249
-
250
-
251
-
252
-
253
-
254
-
255
-
256
-
257
-
258
-
259
-
260
-
261
-
262
-
263
-
264
-
265
-
266
-
267
-
268
-
269
-
270
-
271
-
272
-
273
-
274
-
275
-
276
-
277
-
278
-
279
-
280
-
281
-
282
-
283
-
284
-
285
-
286
-
287
-
288
-
289
-
290
-
291
-
292
-
293
-
294
-
295
-
296
-
297
-
298
-
299
-
300
-
301
-
302
-
303
-
304
-
305
-
306
-
307
-
308
-
309
-
310
-
311
-
312
-
313
-
314
-
315
-
316
-
317
-
318
-
319
-
320
-
321
-
322
-
323
-
324
-
325
-
326
-
327
-
328
-
329
-
330
-
331
-
332
-
333
-
334
-
335
-
336
-
337
-
338
-
339
-
340
-
341
-
342
-
343
-
344
-
345
-
346
-
347
-
348
-
349
-
350
-
351
-
352
-
353
-
354
-
355
-
356
 |
 |

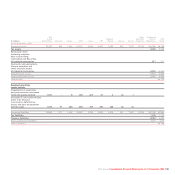
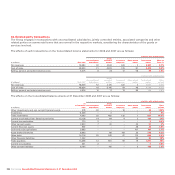
of which: with related parties
At Jointly
31 December Unconsolidated controlled Associated Other related Total related Effect
(€ millions) 2007 Subsidiaries entities companies parties parties on Total
Other investments and non current financial assets 284 44 – 20 – 64 22.5%
Inventories 9,990 – 6 – – 60.1%
Trade receivables 4,384 38 248 80 1 367 8.4%
Current receivables from financing activities 12,268 111 199 21 – 331 2.7%
Current tax receivables 1,153 1 – – – 10.1%
Other current assets 2,291 165 36 3 – 204 8.9%
Current financial assets 1,016 – – – – ––
Cash and cash equivalents 6,639 – – – – ––
Asset-backed financing 6,820 – 141 155 – 296 4.3%
Other debt 11,131 40 217 64 – 321 2.9%
Other financial liabilities 188 – – – – ––
Trade payables 14,725 30 1,012 40 25 1,107 7.5%
Current tax payables 631 1 – – – 10.2%
Other current liabilities 6,572 1 116 – 4 121 1.8%
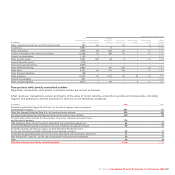
Transactions with jointly controlled entities
Significant transactions with jointly controlled entities are set out as follows:
Net revenues: transactions consist principally of the sales of motor vehicles, production systems and components, including
engines and gearboxes, and the provision of services, to the following companies:
(€ millions) 2008 2007
Società Europea Veicoli Leggeri-Sevel S.p.A., for the sale of engines, other components
and production systems 937 771
Tofas-Turk Otomobil Fabrikasi Tofas A.S., for the sale of motor vehicles 914 942
Fiat Group Automobiles Financial Services S.p.A. for the sale of motor vehicles 190 148
Fiat India Automobiles Limited, for the provision of services, recharges of research costs
and the sale of materials 179 –
CNH de Mexico SA de CV, for the sale of agricultural and construction equipment 86 26
Iveco Fiat-Oto Melara Società consortile, for the sale of vehicles and special transport 58 90
Société Européenne de Véhicules Légers du Nord-Sevelnord Société Anonyme,
for the sale of engines and other components and production systems 58 73
Turk Traktor Ve Ziraat Makineleri A.S., for the sale of agricultural and construction equipment 41 21
New Holland HFT Japan Inc., for the sale of agricultural and construction equipment 28 15
Other 33 39
Total Net revenues from jointly controlled entities 2,524 2,125
Fiat Group Consolidated Financial Statements at 31 December 2008 207