Chrysler 2008 Annual Report Download - page 137
Download and view the complete annual report
Please find page 137 of the 2008 Chrysler annual report below. You can navigate through the pages in the report by either clicking on the pages listed below, or by using the keyword search tool below to find specific information within the annual report.-
 1
1 -
2
-
3
-
4
-
5
-
6
-
7
-
8
-
9
-
10
-
11
-
12
-
13
-
14
-
15
-
16
-
17
-
18
-
19
-
20
-
21
-
22
-
23
-
24
-
25
-
26
-
27
-
28
-
29
-
30
-
31
-
32
-
33
-
34
-
35
-
36
-
37
-
38
-
39
-
40
-
41
-
42
-
43
-
44
-
45
-
46
-
47
-
48
-
49
-
50
-
51
-
52
-
53
-
54
-
55
-
56
-
57
-
58
-
59
-
60
-
61
-
62
-
63
-
64
-
65
-
66
-
67
-
68
-
69
-
70
-
71
-
72
-
73
-
74
-
75
-
76
-
77
-
78
-
79
-
80
-
81
-
82
-
83
-
84
-
85
-
86
-
87
-
88
-
89
-
90
-
91
-
92
-
93
-
94
-
95
-
96
-
97
-
98
-
99
-
100
-
101
-
102
-
103
-
104
-
105
-
106
-
107
-
108
-
109
-
110
-
111
-
112
-
113
-
114
-
115
-
116
-
117
-
118
-
119
-
120
-
121
-
122
-
123
-
124
-
125
-
126
-
 127
127 -
 128
128 -
 129
129 -
 130
130 -
 131
131 -
 132
132 -
 133
133 -
 134
134 -
 135
135 -
 136
136 -
 137
137 -
 138
138 -
 139
139 -
 140
140 -
 141
141 -
 142
142 -
 143
143 -
 144
144 -
 145
145 -
 146
146 -
 147
147 -
148
-
149
-
150
-
151
-
152
-
153
-
154
-
155
-
156
-
157
-
158
-
159
-
160
-
161
-
162
-
163
-
164
-
165
-
166
-
167
-
168
-
169
-
170
-
171
-
172
-
173
-
174
-
175
-
176
-
177
-
178
-
179
-
180
-
181
-
182
-
183
-
184
-
185
-
186
-
187
-
188
-
189
-
190
-
191
-
192
-
193
-
194
-
195
-
196
-
197
-
198
-
199
-
200
-
201
-
202
-
203
-
204
-
205
-
206
-
207
-
208
-
209
-
210
-
211
-
212
-
213
-
214
-
215
-
216
-
217
-
218
-
219
-
220
-
221
-
222
-
223
-
224
-
225
-
226
-
227
-
228
-
229
-
230
-
231
-
232
-
233
-
234
-
235
-
236
-
237
-
238
-
239
-
240
-
241
-
242
-
243
-
244
-
245
-
246
-
247
-
248
-
249
-
250
-
251
-
252
-
253
-
254
-
255
-
256
-
257
-
258
-
259
-
260
-
261
-
262
-
263
-
264
-
265
-
266
-
267
-
268
-
269
-
270
-
271
-
272
-
273
-
274
-
275
-
276
-
277
-
278
-
279
-
280
-
281
-
282
-
283
-
284
-
285
-
286
-
287
-
288
-
289
-
290
-
291
-
292
-
293
-
294
-
295
-
296
-
297
-
298
-
299
-
300
-
301
-
302
-
303
-
304
-
305
-
306
-
307
-
308
-
309
-
310
-
311
-
312
-
313
-
314
-
315
-
316
-
317
-
318
-
319
-
320
-
321
-
322
-
323
-
324
-
325
-
326
-
327
-
328
-
329
-
330
-
331
-
332
-
333
-
334
-
335
-
336
-
337
-
338
-
339
-
340
-
341
-
342
-
343
-
344
-
345
-
346
-
347
-
348
-
349
-
350
-
351
-
352
-
353
-
354
-
355
-
356
 |
 |

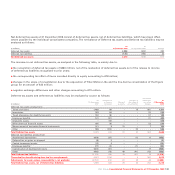
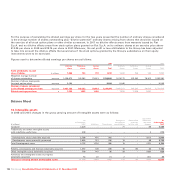
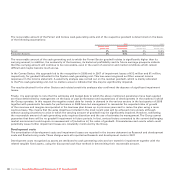
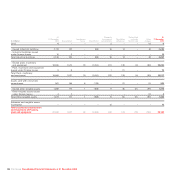
For the purpose of calculating the diluted earnings per share for the two years presented the number of ordinary shares considered
is the average number of shares outstanding plus “dilutive potential” ordinary shares arising from shares that would be issued on
the exercise of all stock option plans or other similar as warrant. In 2007 no dilutive effects arose from warrants issued by Fiat
S.p.A. and no dilutive effects arose from stock option plans granted on Fiat S.p.A. on its ordinary shares at an exercise price above
€12.35 per share in 2008 and €19.74 per share in 2007. Moreover, the net profit or loss attributable to the Group has been adjusted
to take into account the dilutive effects that would arise if the stock options granted by the Group’s subsidiaries on their equity
instruments were to be exercised.
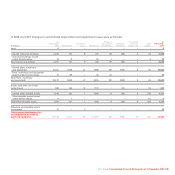
Figures used to determine diluted earnings per shares are as follows:
2008 2007
Ordinary Preference Saving Ordinary Preference Saving
shares shares shares Total shares shares shares Total
Profit attributable to each
class of shares € millions 1,364 133 115 1,612 1,660 158 134 1,952
Weighted average number
of shares outstanding thousand 1,056,675 103,292 79,913 1,239,880 1,079,175 103,292 79,913 1,262,380
Number of shares deployable
for stock option plans thousand 5,094 – – 5,094 9,046 – – 9,046
Number of shares considered
in the diluted earnings per share thousand 1,061,769 103,292 79,913 1,244,974 1,088,221 103,292 79,913 1,271,426
Diluted earnings per share €1.285 1.285 1.440 1.526 1.526 1.681
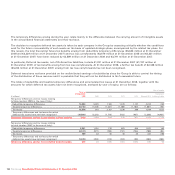
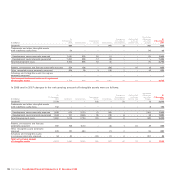
Balance Sheet
14. Intangible assets
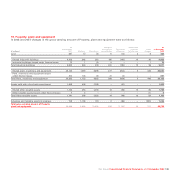
In 2008 and 2007, changes in the gross carrying amount of Intangible assets were as follows:
Translation
At Changes in Reclassified differences At
31 December the scope of to Assets and other 31 December
(€ millions) 2007 Additions Divestitures consolidation held for sale changes 2008
Goodwill 3,329 – – 71 – 89 3,489
Trademarks and other intangible assets
with indefinite useful lives 208 – – – – 5 213
- Development costs externally acquired 2,768 475 (43) – – (210) 2,990
- Development costs internally generated 2,964 741 (56) 19 – 88 3,756
Total Development costs 5,732 1,216 (99) 19 – (122) 6,746
Patents, concessions and licenses externally acquired 1,057 108 (26) 16 (8) 43 1,190
Other intangible assets externally acquired 758 147 (6) 29 – (108) 820
Advances and intangible assets in progress
externally acquired 54 20 (1) 2 – (27) 48
Total gross carrying amount of Intangible assets 11,138 1,491 (132) 137 (8) (120) 12,506
Fiat Group Consolidated Financial Statements at 31 December 2008136