Chrysler 2008 Annual Report Download - page 52
Download and view the complete annual report
Please find page 52 of the 2008 Chrysler annual report below. You can navigate through the pages in the report by either clicking on the pages listed below, or by using the keyword search tool below to find specific information within the annual report.-
 1
1 -
2
-
3
-
4
-
5
-
6
-
7
-
8
-
9
-
10
-
11
-
12
-
13
-
14
-
15
-
16
-
17
-
18
-
19
-
20
-
21
-
22
-
23
-
24
-
25
-
26
-
27
-
28
-
29
-
30
-
31
-
32
-
33
-
34
-
35
-
36
-
37
-
38
-
39
-
40
-
41
-
 42
42 -
 43
43 -
 44
44 -
 45
45 -
 46
46 -
 47
47 -
 48
48 -
 49
49 -
 50
50 -
 51
51 -
 52
52 -
 53
53 -
 54
54 -
 55
55 -
 56
56 -
 57
57 -
 58
58 -
 59
59 -
 60
60 -
 61
61 -
 62
62 -
63
-
64
-
65
-
66
-
67
-
68
-
69
-
70
-
71
-
72
-
73
-
74
-
75
-
76
-
77
-
78
-
79
-
80
-
81
-
82
-
83
-
84
-
85
-
86
-
87
-
88
-
89
-
90
-
91
-
92
-
93
-
94
-
95
-
96
-
97
-
98
-
99
-
100
-
101
-
102
-
103
-
104
-
105
-
106
-
107
-
108
-
109
-
110
-
111
-
112
-
113
-
114
-
115
-
116
-
117
-
118
-
119
-
120
-
121
-
122
-
123
-
124
-
125
-
126
-
127
-
128
-
129
-
130
-
131
-
132
-
133
-
134
-
135
-
136
-
137
-
138
-
139
-
140
-
141
-
142
-
143
-
144
-
145
-
146
-
147
-
148
-
149
-
150
-
151
-
152
-
153
-
154
-
155
-
156
-
157
-
158
-
159
-
160
-
161
-
162
-
163
-
164
-
165
-
166
-
167
-
168
-
169
-
170
-
171
-
172
-
173
-
174
-
175
-
176
-
177
-
178
-
179
-
180
-
181
-
182
-
183
-
184
-
185
-
186
-
187
-
188
-
189
-
190
-
191
-
192
-
193
-
194
-
195
-
196
-
197
-
198
-
199
-
200
-
201
-
202
-
203
-
204
-
205
-
206
-
207
-
208
-
209
-
210
-
211
-
212
-
213
-
214
-
215
-
216
-
217
-
218
-
219
-
220
-
221
-
222
-
223
-
224
-
225
-
226
-
227
-
228
-
229
-
230
-
231
-
232
-
233
-
234
-
235
-
236
-
237
-
238
-
239
-
240
-
241
-
242
-
243
-
244
-
245
-
246
-
247
-
248
-
249
-
250
-
251
-
252
-
253
-
254
-
255
-
256
-
257
-
258
-
259
-
260
-
261
-
262
-
263
-
264
-
265
-
266
-
267
-
268
-
269
-
270
-
271
-
272
-
273
-
274
-
275
-
276
-
277
-
278
-
279
-
280
-
281
-
282
-
283
-
284
-
285
-
286
-
287
-
288
-
289
-
290
-
291
-
292
-
293
-
294
-
295
-
296
-
297
-
298
-
299
-
300
-
301
-
302
-
303
-
304
-
305
-
306
-
307
-
308
-
309
-
310
-
311
-
312
-
313
-
314
-
315
-
316
-
317
-
318
-
319
-
320
-
321
-
322
-
323
-
324
-
325
-
326
-
327
-
328
-
329
-
330
-
331
-
332
-
333
-
334
-
335
-
336
-
337
-
338
-
339
-
340
-
341
-
342
-
343
-
344
-
345
-
346
-
347
-
348
-
349
-
350
-
351
-
352
-
353
-
354
-
355
-
356
 |
 |

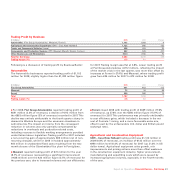
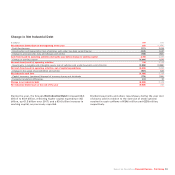
Report on Operations Financial Review – Fiat Group 51
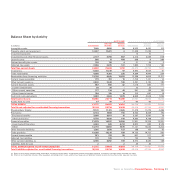
Balance Sheet by Activity
At 31.12.2008 At 31.12.2007
Industrial Financial Industrial Financial
(€ millions) Consolidated Activities Services Consolidated Activities Services
Intangible assets 7,048 6,950 98 6,523 6,420 103
Property, plant and equipment 12,607 12,601 6 11,246 11,239 7
Investment property –––10 10 –
Investments and other financial assets 2,177 3,756 987 2,214 4,339 918
Leased assets 505 11 494 396 8 388
Defined benefit plan assets 120 116 4 31 29 2
Deferred tax assets 2,386 2,225 161 1,892 1,708 184
Total Non-current Assets 24,843 25,659 1,750 22,312 23,753 1,602
Inventories 11,346 11,249 97 9,990 9,929 61
Trade receivables 4,390 4,301 235 4,384 4,444 324
Receivables from financing activities 13,136 6,448 13,420 12,268 4,606 12,211
Current taxes receivable 770 761 15 1,153 1,141 14
Other current assets (a) 2,600 2,443 188 2,291 2,135 180
Current financial assets 967 908 62 1,016 845 171
- Current investments 26 26 – 22 22 –
- Other current securities 177 134 43 291 136 155
- Other financial assets 764 748 19 703 687 16
Cash and cash equivalents 3,683 2,604 1,079 6,639 5,546 1,093
Total Current Assets 36,892 28,714 15,096 37,741 28,646 14,054
Assets held for sale 37 30 7 83 83 –
TOTAL ASSETS 61,772 54,403 16,853 60,136 52,482 15,656
Total Assets adjusted for asset-backed financing transactions 55,109 53,734 10,839 53,316 51,799 9,507
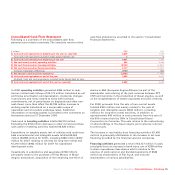
Shareholders’ Equity 11,101 11,101 2,565 11,279 11,279 2,486
Provisions: 8,144 7,989 155 8,562 8,369 193
- Employee benefits 3,366 3,351 15 3,597 3,581 16
- Other provisions 4,778 4,638 140 4,965 4,788 177
Financial payables 21,379 14,522 13,590 17,951 10,706 12,351
- Asset-backed financing 6,663 669 6,014 6,820 683 6,149
- Other 14,716 13,853 7,576 11,131 10,023 6,202
Other financial liabilities 1,202 1,078 127 188 153 35
Trade payables 13,258 13,216 189 14,725 14,751 361
Current taxes payable 331 276 55 631 571 62
Deferred tax liabilities 170 169 1 193 193 –
Other current liabilities (b) 6,185 6,052 169 6,572 6,425 168
Liabilities held for sale 2–235 35 –
TOTAL SHAREHOLDERS' EQUITY AND LIABILITIES 61,772 54,403 16,853 60,136 52,482 15,656
Total Liabilities adjusted for asset-backed financing transactions 55,109 53,734 10,839 53,316 51,799 9,507
(a) Other current assets includes Other receivables, excluding current taxes, and Accrued income and prepaid expense, previously classified under separate line items.
(b) Other current liabilities includes Other payables, excluding current taxes, and Accrued expense and deferred income, previously classified under separate line items.