Chrysler 2008 Annual Report Download - page 44
Download and view the complete annual report
Please find page 44 of the 2008 Chrysler annual report below. You can navigate through the pages in the report by either clicking on the pages listed below, or by using the keyword search tool below to find specific information within the annual report.-
 1
1 -
2
-
3
-
4
-
5
-
6
-
7
-
8
-
9
-
10
-
11
-
12
-
13
-
14
-
15
-
16
-
17
-
18
-
19
-
20
-
21
-
22
-
23
-
24
-
25
-
26
-
27
-
28
-
29
-
30
-
31
-
32
-
33
-
 34
34 -
 35
35 -
 36
36 -
 37
37 -
 38
38 -
 39
39 -
 40
40 -
 41
41 -
 42
42 -
 43
43 -
 44
44 -
 45
45 -
 46
46 -
 47
47 -
 48
48 -
 49
49 -
 50
50 -
 51
51 -
 52
52 -
 53
53 -
 54
54 -
55
-
56
-
57
-
58
-
59
-
60
-
61
-
62
-
63
-
64
-
65
-
66
-
67
-
68
-
69
-
70
-
71
-
72
-
73
-
74
-
75
-
76
-
77
-
78
-
79
-
80
-
81
-
82
-
83
-
84
-
85
-
86
-
87
-
88
-
89
-
90
-
91
-
92
-
93
-
94
-
95
-
96
-
97
-
98
-
99
-
100
-
101
-
102
-
103
-
104
-
105
-
106
-
107
-
108
-
109
-
110
-
111
-
112
-
113
-
114
-
115
-
116
-
117
-
118
-
119
-
120
-
121
-
122
-
123
-
124
-
125
-
126
-
127
-
128
-
129
-
130
-
131
-
132
-
133
-
134
-
135
-
136
-
137
-
138
-
139
-
140
-
141
-
142
-
143
-
144
-
145
-
146
-
147
-
148
-
149
-
150
-
151
-
152
-
153
-
154
-
155
-
156
-
157
-
158
-
159
-
160
-
161
-
162
-
163
-
164
-
165
-
166
-
167
-
168
-
169
-
170
-
171
-
172
-
173
-
174
-
175
-
176
-
177
-
178
-
179
-
180
-
181
-
182
-
183
-
184
-
185
-
186
-
187
-
188
-
189
-
190
-
191
-
192
-
193
-
194
-
195
-
196
-
197
-
198
-
199
-
200
-
201
-
202
-
203
-
204
-
205
-
206
-
207
-
208
-
209
-
210
-
211
-
212
-
213
-
214
-
215
-
216
-
217
-
218
-
219
-
220
-
221
-
222
-
223
-
224
-
225
-
226
-
227
-
228
-
229
-
230
-
231
-
232
-
233
-
234
-
235
-
236
-
237
-
238
-
239
-
240
-
241
-
242
-
243
-
244
-
245
-
246
-
247
-
248
-
249
-
250
-
251
-
252
-
253
-
254
-
255
-
256
-
257
-
258
-
259
-
260
-
261
-
262
-
263
-
264
-
265
-
266
-
267
-
268
-
269
-
270
-
271
-
272
-
273
-
274
-
275
-
276
-
277
-
278
-
279
-
280
-
281
-
282
-
283
-
284
-
285
-
286
-
287
-
288
-
289
-
290
-
291
-
292
-
293
-
294
-
295
-
296
-
297
-
298
-
299
-
300
-
301
-
302
-
303
-
304
-
305
-
306
-
307
-
308
-
309
-
310
-
311
-
312
-
313
-
314
-
315
-
316
-
317
-
318
-
319
-
320
-
321
-
322
-
323
-
324
-
325
-
326
-
327
-
328
-
329
-
330
-
331
-
332
-
333
-
334
-
335
-
336
-
337
-
338
-
339
-
340
-
341
-
342
-
343
-
344
-
345
-
346
-
347
-
348
-
349
-
350
-
351
-
352
-
353
-
354
-
355
-
356
 |
 |

Report on Operations Financial Review – Fiat Group 43
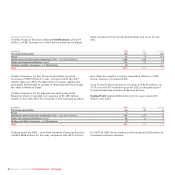
Net gains on the disposal of investments totalled €20 million
in 2008 and included gains of €14 million on the sale of the
interest in S.C.M. Ltda and €4 million on the sale of Targasys
S.r.l.
In 2007, this item totalled €190 million and mainly consisted of
a gain of €118 million on the sale of the interest held in
Mediobanca S.p.A. and a gain of €42 million following
completion of the sale of Ingest Facility S.p.A.
Restructuring costs totalled €165 million and mainly relate to
Fiat Group Automobiles (€62 million) and Magneti Marelli (€77
million).
In 2007, these costs totalled €105 million and related primarily
to Fiat Group Automobiles (€40 million), Agricultural and
Construction Equipment (€30 million) and Comau (€21 million).
Other unusual income/(expense) was a negative €245 million
and mainly included costs relating to the rationalisation of
strategic suppliers (€74 million) and additional provisions,
associated with the serious and abrupt crisis in the automotive
market globally, recognised by FGA and Iveco primarily for
residual value risk on both leased vehicles, vehicles sold under
buy-back commitments and used vehicles in stock (€166
million).
In 2007, this item reflected a net expense of €166 million which
was mainly attributable to rationalisation of several strategic
suppliers, some of which were acquired in 2007.
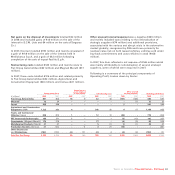
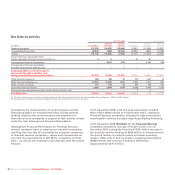
Following is a summary of the principal components of
Operating Profit, broken down by Sector:
(€ millions) 2008 2007 2008 2007 2008 2007 2008 2007 2008 2007
Fiat Group Automobiles 691 803 18 862 40 (187) (136) 460 635
Maserati 72 24 –––––(2) 72 22
Ferrari 339 266 – – – – 2 – 341 266
Agricultural and Construction
Equipment (CNH) 1,122 990 4 – (14) 30 6(7) 1,146 953
Trucks and Commercial
Vehicles (Iveco) 838 813 1–1210 (48) – 779 803
FPT Powertrain Technologies 166 271 1––1(5) (13) 162 257
Components (Magneti Marelli) 174 214 – – 77 – (4) (5) 93 209
Metallurgical Products (Teksid) 41 47 ––5(1) 13 (1) 49 47
Production Systems (Comau) 21 (23) –11 321 (18) – – (33)
Other Businesses
and Eliminations (102) (172) (4) 171 20 4(4) (2) (130) (7)
Total for the Group 3,362 3,233 20 190 165 105 (245) (166) 2,972 3,152
Trading profit/(loss)
Gains/(losses)
on the disposal
of investments Restructuring costs
Other unusual
income/(expense) Operating profit/(loss)