Chrysler 2008 Annual Report Download - page 82
Download and view the complete annual report
Please find page 82 of the 2008 Chrysler annual report below. You can navigate through the pages in the report by either clicking on the pages listed below, or by using the keyword search tool below to find specific information within the annual report.-
 1
1 -
2
-
3
-
4
-
5
-
6
-
7
-
8
-
9
-
10
-
11
-
12
-
13
-
14
-
15
-
16
-
17
-
18
-
19
-
20
-
21
-
22
-
23
-
24
-
25
-
26
-
27
-
28
-
29
-
30
-
31
-
32
-
33
-
34
-
35
-
36
-
37
-
38
-
39
-
40
-
41
-
42
-
43
-
44
-
45
-
46
-
47
-
48
-
49
-
50
-
51
-
52
-
53
-
54
-
55
-
56
-
57
-
58
-
59
-
60
-
61
-
62
-
63
-
64
-
65
-
66
-
67
-
68
-
69
-
70
-
71
-
 72
72 -
 73
73 -
 74
74 -
 75
75 -
 76
76 -
 77
77 -
 78
78 -
 79
79 -
 80
80 -
 81
81 -
 82
82 -
 83
83 -
 84
84 -
 85
85 -
 86
86 -
 87
87 -
 88
88 -
 89
89 -
 90
90 -
 91
91 -
 92
92 -
93
-
94
-
95
-
96
-
97
-
98
-
99
-
100
-
101
-
102
-
103
-
104
-
105
-
106
-
107
-
108
-
109
-
110
-
111
-
112
-
113
-
114
-
115
-
116
-
117
-
118
-
119
-
120
-
121
-
122
-
123
-
124
-
125
-
126
-
127
-
128
-
129
-
130
-
131
-
132
-
133
-
134
-
135
-
136
-
137
-
138
-
139
-
140
-
141
-
142
-
143
-
144
-
145
-
146
-
147
-
148
-
149
-
150
-
151
-
152
-
153
-
154
-
155
-
156
-
157
-
158
-
159
-
160
-
161
-
162
-
163
-
164
-
165
-
166
-
167
-
168
-
169
-
170
-
171
-
172
-
173
-
174
-
175
-
176
-
177
-
178
-
179
-
180
-
181
-
182
-
183
-
184
-
185
-
186
-
187
-
188
-
189
-
190
-
191
-
192
-
193
-
194
-
195
-
196
-
197
-
198
-
199
-
200
-
201
-
202
-
203
-
204
-
205
-
206
-
207
-
208
-
209
-
210
-
211
-
212
-
213
-
214
-
215
-
216
-
217
-
218
-
219
-
220
-
221
-
222
-
223
-
224
-
225
-
226
-
227
-
228
-
229
-
230
-
231
-
232
-
233
-
234
-
235
-
236
-
237
-
238
-
239
-
240
-
241
-
242
-
243
-
244
-
245
-
246
-
247
-
248
-
249
-
250
-
251
-
252
-
253
-
254
-
255
-
256
-
257
-
258
-
259
-
260
-
261
-
262
-
263
-
264
-
265
-
266
-
267
-
268
-
269
-
270
-
271
-
272
-
273
-
274
-
275
-
276
-
277
-
278
-
279
-
280
-
281
-
282
-
283
-
284
-
285
-
286
-
287
-
288
-
289
-
290
-
291
-
292
-
293
-
294
-
295
-
296
-
297
-
298
-
299
-
300
-
301
-
302
-
303
-
304
-
305
-
306
-
307
-
308
-
309
-
310
-
311
-
312
-
313
-
314
-
315
-
316
-
317
-
318
-
319
-
320
-
321
-
322
-
323
-
324
-
325
-
326
-
327
-
328
-
329
-
330
-
331
-
332
-
333
-
334
-
335
-
336
-
337
-
338
-
339
-
340
-
341
-
342
-
343
-
344
-
345
-
346
-
347
-
348
-
349
-
350
-
351
-
352
-
353
-
354
-
355
-
356
 |
 |
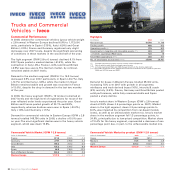
Report on Operations Iveco 81
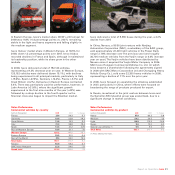
In Eastern Europe, Iveco’s market share (GVW ≥ 2.8 tonnes) for
2008 was 11.8% (-0.4 percentage points vs. 2007), remaining
stable in the light and heavy segments and falling slightly in
the medium segment.
Iveco Irisbus’ market share in Western Europe, at 18.5% for
2008, down 1.3 percentage points over 2007. Iveco Irisbus
recorded declines in France and Spain, although it maintained
its leadership position, while its share grew in the other
markets.
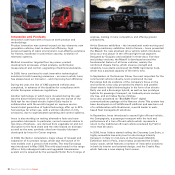
In 2008, Iveco delivered a total of 192,143 vehicles,
representing a 9.2% decrease year on year. In Western Europe,
125,152 vehicles were delivered (down 15.1%), with declines
being experienced in all principal markets, particularly in Italy
(-19.4%), Spain (-37.5%), Germany (-14.2%), France (-5.7%) and
Great Britain (-3.2%). Deliveries in Eastern Europe contracted
5.4%. There was particularly positive performance, however, in
Latin America (+21.6%), where the significant growth
experienced in the first nine months of the year (+42%) was
followed by a sharp decline in the fourth quarter as the
financial crisis also began to impact the Brazilian market.
Iveco delivered a total of 9,555 buses during the year, a 4.2%
decline from 2007.
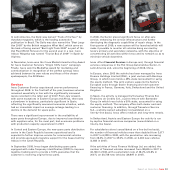
In China, Naveco, a 50/50 joint venture with Nanjing
Automotive Corporation (NAC), a subsidiary of the SAIC group,
sold approximately 22,200 light vehicles in the Power Daily
range (a 7.8% decrease over the previous year) and roughly
36,700 medium vehicles from the Yuejin range (a 4.4% increase
year on year). The Yuejin vehicles have been distributed by
Naveco since it acquired the Yuejin Motor Company in 2006.
SAIC Iveco Hongyan Commercial Vehicles Co. Ltd. (in which
Iveco became a shareholder following the agreements signed
in 2006 with SAIC Motor Corporation Ltd and Chongqing Heavy
Vehicle Group Co.), sold some 22,300 heavy vehicles in 2008,
representing a decline of 7.1% over the prior year.
In 2008, Iveco focused on expanding the alliances established
in 2007, particularly in China, where efforts were focused on
broadening the range of products produced for export.
In Russia, investment in the joint venture between Iveco and
the Samotlor-NN industrial group was scaled back, due to a
significant change in market conditions.
Sales Performance
Commercial vehicles by country
(units in thousands) 2008 2007 % change
France 27.6 29.3 -5.7
Germany 19.6 22.8 -14,2
Great Britain 13.8 14.3 -3.2
Italy 31.3 38.8 -19.4
Spain 13.3 21.2 -37.5
Rest of Western Europe 19.6 21.1 -7.0
Western Europe 125.2 147.5 -15.1
Eastern Europe 29.5 31.2 -5.4
Rest of the World 37.4 33.0 13.5
Total Sales 192.1 211.7 -9.2
Naveco 58.9 59.3 -0.7
SAIC Iveco Hongyan 22.3 24.0 -7.1
Grand total 273.3 295.0 -7.4
Sales Performance
Commercial vehicles by product
(units in thousands) 2008 2007 % change
Heavy 57.9 60.2 -3.8
Medium 20.2 20.5 -1.3
Light 98.9 11 5 . 5 - 1 4 . 4
Buses 9.6 10.0 -4.2
Special-use vehicles (*) 5.5 5.5 -0.1
Total Sales 192.1 211.7 -9.2
(*) Astra, defence, fire trucks.