Chrysler 2008 Annual Report Download - page 21
Download and view the complete annual report
Please find page 21 of the 2008 Chrysler annual report below. You can navigate through the pages in the report by either clicking on the pages listed below, or by using the keyword search tool below to find specific information within the annual report.-
 1
1 -
2
-
3
-
4
-
5
-
6
-
7
-
8
-
9
-
10
-
 11
11 -
 12
12 -
 13
13 -
 14
14 -
 15
15 -
 16
16 -
 17
17 -
 18
18 -
 19
19 -
 20
20 -
 21
21 -
 22
22 -
 23
23 -
 24
24 -
 25
25 -
 26
26 -
 27
27 -
 28
28 -
 29
29 -
 30
30 -
 31
31 -
32
-
33
-
34
-
35
-
36
-
37
-
38
-
39
-
40
-
41
-
42
-
43
-
44
-
45
-
46
-
47
-
48
-
49
-
50
-
51
-
52
-
53
-
54
-
55
-
56
-
57
-
58
-
59
-
60
-
61
-
62
-
63
-
64
-
65
-
66
-
67
-
68
-
69
-
70
-
71
-
72
-
73
-
74
-
75
-
76
-
77
-
78
-
79
-
80
-
81
-
82
-
83
-
84
-
85
-
86
-
87
-
88
-
89
-
90
-
91
-
92
-
93
-
94
-
95
-
96
-
97
-
98
-
99
-
100
-
101
-
102
-
103
-
104
-
105
-
106
-
107
-
108
-
109
-
110
-
111
-
112
-
113
-
114
-
115
-
116
-
117
-
118
-
119
-
120
-
121
-
122
-
123
-
124
-
125
-
126
-
127
-
128
-
129
-
130
-
131
-
132
-
133
-
134
-
135
-
136
-
137
-
138
-
139
-
140
-
141
-
142
-
143
-
144
-
145
-
146
-
147
-
148
-
149
-
150
-
151
-
152
-
153
-
154
-
155
-
156
-
157
-
158
-
159
-
160
-
161
-
162
-
163
-
164
-
165
-
166
-
167
-
168
-
169
-
170
-
171
-
172
-
173
-
174
-
175
-
176
-
177
-
178
-
179
-
180
-
181
-
182
-
183
-
184
-
185
-
186
-
187
-
188
-
189
-
190
-
191
-
192
-
193
-
194
-
195
-
196
-
197
-
198
-
199
-
200
-
201
-
202
-
203
-
204
-
205
-
206
-
207
-
208
-
209
-
210
-
211
-
212
-
213
-
214
-
215
-
216
-
217
-
218
-
219
-
220
-
221
-
222
-
223
-
224
-
225
-
226
-
227
-
228
-
229
-
230
-
231
-
232
-
233
-
234
-
235
-
236
-
237
-
238
-
239
-
240
-
241
-
242
-
243
-
244
-
245
-
246
-
247
-
248
-
249
-
250
-
251
-
252
-
253
-
254
-
255
-
256
-
257
-
258
-
259
-
260
-
261
-
262
-
263
-
264
-
265
-
266
-
267
-
268
-
269
-
270
-
271
-
272
-
273
-
274
-
275
-
276
-
277
-
278
-
279
-
280
-
281
-
282
-
283
-
284
-
285
-
286
-
287
-
288
-
289
-
290
-
291
-
292
-
293
-
294
-
295
-
296
-
297
-
298
-
299
-
300
-
301
-
302
-
303
-
304
-
305
-
306
-
307
-
308
-
309
-
310
-
311
-
312
-
313
-
314
-
315
-
316
-
317
-
318
-
319
-
320
-
321
-
322
-
323
-
324
-
325
-
326
-
327
-
328
-
329
-
330
-
331
-
332
-
333
-
334
-
335
-
336
-
337
-
338
-
339
-
340
-
341
-
342
-
343
-
344
-
345
-
346
-
347
-
348
-
349
-
350
-
351
-
352
-
353
-
354
-
355
-
356
 |
 |

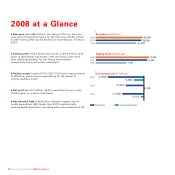
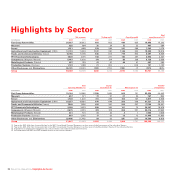
Report on Operations Highlights by Sector20
Highlights by Sector
Net revenues Trading profit Operating profit
Total
operating assets (1)
Capital
expenditure (3)
Total
operating liabilities (2) R&D expense (4)
Number
of employees
(€ millions) 2008 2007 2008 2007 2008 2007 2008 2007
Fiat Group Automobiles 26,937 26,812 691 803 460 635 15,958 15,203
Maserati 825 694 72 24 72 22 437 364
Ferrari 1,921 1,668 339 266 341 266 1,542 1,079
Agricultural and Construction Equipment (CNH) 12,723 11,843 1,122 990 1,146 953 19,958 18,816
Trucks and Commercial Vehicles (Iveco) 10,768 11 , 19 6 838 813 779 803 8,097 6,839
FPT Powertrain Technologies 7,000 7,075 166 271 162 257 4,953 4,337
Components (Magneti Marelli) 5,447 5,000 174 214 93 209 3,123 2,658
Metallurgical Products (Teksid) 837 783 41 47 49 47 497 565
Production Systems (Comau) 1,123 1,089 21 (23) –(33) 751 1,132
Other Businesses and Eliminations (8,201) (7,631) (102) (172) (130) (7) (575) (825)
Group 59,380 58,529 3,362 3,233 2,972 3,152 54,741 50,168
(€ millions) 2008 2007 2008 2007 2008 2007 2008 2007
Fiat Group Automobiles 15,184 16,860 2,288 1,865 843 751 52,634 50,542
Maserati 657 571 73 97 47 54 767 695
Ferrari 1,726 1,300 311 246 164 147 3,017 2,926
Agricultural and Construction Equipment (CNH) 20,257 19,891 676 648 286 308 31,521 28,173
Trucks and Commercial Vehicles (Iveco) 7,948 7,690 426 347 246 207 27,108 26,461
FPT Powertrain Technologies 3,908 3,823 898 365 141 70 20,507 19,876
Components (Magneti Marelli) 2,675 2,915 474 319 268 221 33,216 27,962
Metallurgical Products (Teksid) 431 501 41 32 317, 6 0 0 7,826
Production Systems (Comau) 667 1,052 17 33 13 12 11,445 11,960
Other Businesses and Eliminations (2,006) (1,740) 59 33 (25) (30) 10,533 8,806
Group 51,447 52,863 5,263 3,985 1,986 1,741 198,348 185,227
(1) Figures for 2007 differ from those published in the 2007 Consolidated Financial Statements as they also include Investments of the individual Sectors.
(2) Figures for 2007 differ from those published in the 2007 Consolidated Financial Statements as they also include Shareholders’ Equity of the individual Sectors.
(3) Expenditure in tangible and intangible assets (net of vehicles sold under buy-back commitments).
(4) Including capitalised R&D and R&D charged directly to the income statement.