Chrysler 2008 Annual Report Download - page 43
Download and view the complete annual report
Please find page 43 of the 2008 Chrysler annual report below. You can navigate through the pages in the report by either clicking on the pages listed below, or by using the keyword search tool below to find specific information within the annual report.-
 1
1 -
2
-
3
-
4
-
5
-
6
-
7
-
8
-
9
-
10
-
11
-
12
-
13
-
14
-
15
-
16
-
17
-
18
-
19
-
20
-
21
-
22
-
23
-
24
-
25
-
26
-
27
-
28
-
29
-
30
-
31
-
32
-
 33
33 -
 34
34 -
 35
35 -
 36
36 -
 37
37 -
 38
38 -
 39
39 -
 40
40 -
 41
41 -
 42
42 -
 43
43 -
 44
44 -
 45
45 -
 46
46 -
 47
47 -
 48
48 -
 49
49 -
 50
50 -
 51
51 -
 52
52 -
 53
53 -
54
-
55
-
56
-
57
-
58
-
59
-
60
-
61
-
62
-
63
-
64
-
65
-
66
-
67
-
68
-
69
-
70
-
71
-
72
-
73
-
74
-
75
-
76
-
77
-
78
-
79
-
80
-
81
-
82
-
83
-
84
-
85
-
86
-
87
-
88
-
89
-
90
-
91
-
92
-
93
-
94
-
95
-
96
-
97
-
98
-
99
-
100
-
101
-
102
-
103
-
104
-
105
-
106
-
107
-
108
-
109
-
110
-
111
-
112
-
113
-
114
-
115
-
116
-
117
-
118
-
119
-
120
-
121
-
122
-
123
-
124
-
125
-
126
-
127
-
128
-
129
-
130
-
131
-
132
-
133
-
134
-
135
-
136
-
137
-
138
-
139
-
140
-
141
-
142
-
143
-
144
-
145
-
146
-
147
-
148
-
149
-
150
-
151
-
152
-
153
-
154
-
155
-
156
-
157
-
158
-
159
-
160
-
161
-
162
-
163
-
164
-
165
-
166
-
167
-
168
-
169
-
170
-
171
-
172
-
173
-
174
-
175
-
176
-
177
-
178
-
179
-
180
-
181
-
182
-
183
-
184
-
185
-
186
-
187
-
188
-
189
-
190
-
191
-
192
-
193
-
194
-
195
-
196
-
197
-
198
-
199
-
200
-
201
-
202
-
203
-
204
-
205
-
206
-
207
-
208
-
209
-
210
-
211
-
212
-
213
-
214
-
215
-
216
-
217
-
218
-
219
-
220
-
221
-
222
-
223
-
224
-
225
-
226
-
227
-
228
-
229
-
230
-
231
-
232
-
233
-
234
-
235
-
236
-
237
-
238
-
239
-
240
-
241
-
242
-
243
-
244
-
245
-
246
-
247
-
248
-
249
-
250
-
251
-
252
-
253
-
254
-
255
-
256
-
257
-
258
-
259
-
260
-
261
-
262
-
263
-
264
-
265
-
266
-
267
-
268
-
269
-
270
-
271
-
272
-
273
-
274
-
275
-
276
-
277
-
278
-
279
-
280
-
281
-
282
-
283
-
284
-
285
-
286
-
287
-
288
-
289
-
290
-
291
-
292
-
293
-
294
-
295
-
296
-
297
-
298
-
299
-
300
-
301
-
302
-
303
-
304
-
305
-
306
-
307
-
308
-
309
-
310
-
311
-
312
-
313
-
314
-
315
-
316
-
317
-
318
-
319
-
320
-
321
-
322
-
323
-
324
-
325
-
326
-
327
-
328
-
329
-
330
-
331
-
332
-
333
-
334
-
335
-
336
-
337
-
338
-
339
-
340
-
341
-
342
-
343
-
344
-
345
-
346
-
347
-
348
-
349
-
350
-
351
-
352
-
353
-
354
-
355
-
356
 |
 |

Report on Operations Financial Review – Fiat Group42
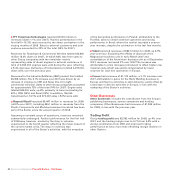
Trucks and Commercial Vehicles
Iveco’s trading profit was €838 million, an increase of €25
million over the €813 million figure posted in 2007. The drop in
sales volumes was offset by better selling prices achieved from
competitive repositioning and a reduced cost of the product.
During the year, measures were implemented to contain
overheads in prompt response to the perceived fall in demand.
The trading margin rose to 7.8% from 7.3% for 2007.
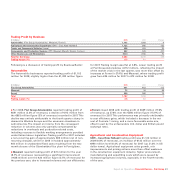
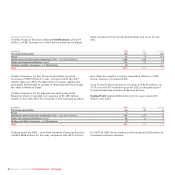
Components and Production Systems
Components and Production Systems reported aggregate
trading profit of €402 million (€509 million for 2007), with a
trading margin of 2.9% (3.8% in 2007). The sharp contraction in
demand impacted trading profit at FPT (down €105 million) and
Magneti Marelli (down €40 million). Teksid’s trading profit was
down €6 million (up €9 million on a comparable basis).
Benefiting from the positive effects of the restructuring and
repositioning of the business, Comau reported an increase in
trading performance of €44 million.
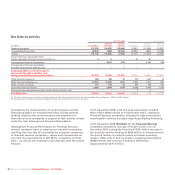
(€ millions) 2008 2007 Change
FPT Powertrain Technologies 166 271 -105
Components (Magneti Marelli) 174 214 -40
Metallurgical Products (Teksid) 41 47 -6
Production Systems (Comau) 21 (23) 44
Total 402 509 -107
Trading margin (%) 2.9 3.8
For 2008, FPT Powertrain Technologies reported trading profit
of €166 million (2.4% of revenues), a €105 million decrease
over the €271 million figure (3.8% of revenues) for 2007. This
decrease was principally the result of a contraction in volumes,
worsening of the sales mix and increases in raw materials
prices, in addition to start-up costs for new ventures in China
and Brazil. There was also a negative impact from costs
recognised in the first quarter of 2008 associated with the
faulty production of 1.3 Multijet engines as a result of a
defective externally provided component. Significant efficiency
gains only partially compensated for these negative factors.
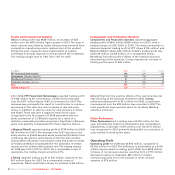
Magneti Marelli reported trading profit of €174 million for 2008
(€214 million for 2007). The decrease over 2007 was due to the
sharp decline in global demand which prevented the Sector from
continuing the positive performance of the first nine months,
during which reductions in production costs and positive results
in Poland and Brazil compensated for the slowdown in certain
regions and an unfavourable product mix. The trading margin
for 2008 was 3.2% (4.3% for 2007). On a comparable scope of
operations, the trading margin would be 3.7%.
Teksid reported trading profit of €41 million, down from the
€47 million figure for 2007. On a comparable scope of
operations, Teksid would have shown an increase of €9 million.
Benefiting from the positive effects of the restructuring and
repositioning of the business initiated in 2006, Comau
achieved trading profit of €21 million for 2008, a significant
improvement over the €23 million loss recorded in 2007. The
most significant improvements were for the Body Welding
activities in Europe.
Other Businesses
Other Businesses had a trading loss of €102 million for the
year, including the impact of eliminations and consolidation
adjustments, a decrease of €70 million over the €172 million
loss recognised in 2007 primarily attributable to a reduction in
costs related to stock option plans.
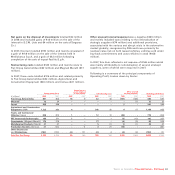
Operating Profit
Operating profit for 2008 was €2,972 million, compared to
€3,152 million for 2007. The difference is attributable to a €129
million improvement in trading profit offset by a €309 million
increase in net unusual expense resulting from a €170 million
decrease in gains on disposals, €60 million in higher
restructuring costs and a net increase in other unusual
expense of €79 million.