Chrysler 2008 Annual Report Download - page 39
Download and view the complete annual report
Please find page 39 of the 2008 Chrysler annual report below. You can navigate through the pages in the report by either clicking on the pages listed below, or by using the keyword search tool below to find specific information within the annual report.-
 1
1 -
2
-
3
-
4
-
5
-
6
-
7
-
8
-
9
-
10
-
11
-
12
-
13
-
14
-
15
-
16
-
17
-
18
-
19
-
20
-
21
-
22
-
23
-
24
-
25
-
26
-
27
-
28
-
 29
29 -
 30
30 -
 31
31 -
 32
32 -
 33
33 -
 34
34 -
 35
35 -
 36
36 -
 37
37 -
 38
38 -
 39
39 -
 40
40 -
 41
41 -
 42
42 -
 43
43 -
 44
44 -
 45
45 -
 46
46 -
 47
47 -
 48
48 -
 49
49 -
50
-
51
-
52
-
53
-
54
-
55
-
56
-
57
-
58
-
59
-
60
-
61
-
62
-
63
-
64
-
65
-
66
-
67
-
68
-
69
-
70
-
71
-
72
-
73
-
74
-
75
-
76
-
77
-
78
-
79
-
80
-
81
-
82
-
83
-
84
-
85
-
86
-
87
-
88
-
89
-
90
-
91
-
92
-
93
-
94
-
95
-
96
-
97
-
98
-
99
-
100
-
101
-
102
-
103
-
104
-
105
-
106
-
107
-
108
-
109
-
110
-
111
-
112
-
113
-
114
-
115
-
116
-
117
-
118
-
119
-
120
-
121
-
122
-
123
-
124
-
125
-
126
-
127
-
128
-
129
-
130
-
131
-
132
-
133
-
134
-
135
-
136
-
137
-
138
-
139
-
140
-
141
-
142
-
143
-
144
-
145
-
146
-
147
-
148
-
149
-
150
-
151
-
152
-
153
-
154
-
155
-
156
-
157
-
158
-
159
-
160
-
161
-
162
-
163
-
164
-
165
-
166
-
167
-
168
-
169
-
170
-
171
-
172
-
173
-
174
-
175
-
176
-
177
-
178
-
179
-
180
-
181
-
182
-
183
-
184
-
185
-
186
-
187
-
188
-
189
-
190
-
191
-
192
-
193
-
194
-
195
-
196
-
197
-
198
-
199
-
200
-
201
-
202
-
203
-
204
-
205
-
206
-
207
-
208
-
209
-
210
-
211
-
212
-
213
-
214
-
215
-
216
-
217
-
218
-
219
-
220
-
221
-
222
-
223
-
224
-
225
-
226
-
227
-
228
-
229
-
230
-
231
-
232
-
233
-
234
-
235
-
236
-
237
-
238
-
239
-
240
-
241
-
242
-
243
-
244
-
245
-
246
-
247
-
248
-
249
-
250
-
251
-
252
-
253
-
254
-
255
-
256
-
257
-
258
-
259
-
260
-
261
-
262
-
263
-
264
-
265
-
266
-
267
-
268
-
269
-
270
-
271
-
272
-
273
-
274
-
275
-
276
-
277
-
278
-
279
-
280
-
281
-
282
-
283
-
284
-
285
-
286
-
287
-
288
-
289
-
290
-
291
-
292
-
293
-
294
-
295
-
296
-
297
-
298
-
299
-
300
-
301
-
302
-
303
-
304
-
305
-
306
-
307
-
308
-
309
-
310
-
311
-
312
-
313
-
314
-
315
-
316
-
317
-
318
-
319
-
320
-
321
-
322
-
323
-
324
-
325
-
326
-
327
-
328
-
329
-
330
-
331
-
332
-
333
-
334
-
335
-
336
-
337
-
338
-
339
-
340
-
341
-
342
-
343
-
344
-
345
-
346
-
347
-
348
-
349
-
350
-
351
-
352
-
353
-
354
-
355
-
356
 |
 |

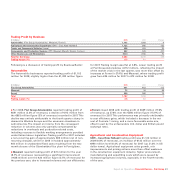
Report on Operations Financial Review – Fiat Group38
(€ millions) 2008 2007 % change
Fiat Group Automobiles 26,937 26,812 0.5
Maserati 825 694 18.9
Ferrari 1,921 1,668 15.2
Eliminations (303) (159) –
Total 29,380 29,015 1.3
Following is a review of net revenues by Business/Sector:
Automobiles
In 2008, the Automobile businesses had revenues of €29,380
million, a slight increase (+1.3%) over 2007.
Revenues for Fiat Group Automobiles were in line with 2007,
while they increased significantly at Maserati (+18.9%) and
Ferrari (+15.2%).
Revenues for Fiat Group Automobiles were €26,937 million,
essentially flat (+0.5%) compared to 2007. The decrease in
volumes (-3.6%) was offset by improved pricing and mix, in
addition to increased sales to joint ventures. Growth in
revenues and deliveries in the first half were offset by declines
in the second half, particularly in the final quarter, due to a
sharp contraction in the automotive market globally.
Fiat Group Automobiles delivered a total of 2,152,500 cars and
light commercial vehicles, down 3.6% from the prior year. For
Western Europe, total deliveries decreased 8.8% to 1,237,900
units in a market which declined 8.4% over the prior year.
Deliveries for the Sector declined in Italy (-16%), but strong
growth was achieved in France (+30.7%) and Germany
(+14.4%), where results ran counter to the trend in market
demand. In Spain (-38.7%) and Great Britain (-8.1%), the
Sector’s performance was in line with the decline in overall
demand.
Fiat Group Automobiles continued to make gains in market
share for passenger vehicles. In Italy, market share reached
31.9%, a 0.6 percentage point increase over 2007. In Western
Europe, market share increased 0.2 percentage points to 8.2%.
In Brazil, demand increased 10.6% over 2007 with significant
growth in the first half (+26.6%) being partly offset by a decline
in the closing months of 2008. Deliveries were up 8.6% over
2007 and the Sector reaffirmed its position as market leader in
passenger cars with a 24.9% market share.
For 2008, Maserati reported €825 million in revenues, an
increase of 18.9% over 2007. This improvement was primarily
attributable to the excellent performance of the GranTurismo,
including the new S sport version.
Ferrari recorded €1,921 million in revenues, up 15.2% year-
over-year, driven primarily by sales of the 430 Scuderia
(launched at the end of 2007), the 599 GTB Fiorano and the 612
Scaglietti, as well as improved pricing and higher revenues
from the racing division.
Agricultural and Construction Equipment
CNH – Case New Holland revenues for 2008 totalled €12,723
million, an increase of 7.4% over 2007. In US dollar terms,
revenues grew by 15.3%. Performance was driven by
continuing strong sales growth in the agricultural equipment
business especially of high horse power tractors and
combines. Sales of construction equipment declined overall as
increases in Latin America and Rest-of-World markets did not
offset declines in North America and Western Europe.
In 2008, the global market for agricultural equipment grew 2%,
with an increase in retail unit volumes for tractors and
combine harvesters over 2007 of 1% and 35%, respectively.
CNH’s brands were well placed to benefit from the agricultural
equipment industry’s strong performance. Worldwide tractor
market share was up with gains in Latin America, Rest-of-World
and in North America for high-powered models, while share
was unchanged in Western Europe. In the fast growing