Chrysler 2008 Annual Report Download - page 48
Download and view the complete annual report
Please find page 48 of the 2008 Chrysler annual report below. You can navigate through the pages in the report by either clicking on the pages listed below, or by using the keyword search tool below to find specific information within the annual report.-
 1
1 -
2
-
3
-
4
-
5
-
6
-
7
-
8
-
9
-
10
-
11
-
12
-
13
-
14
-
15
-
16
-
17
-
18
-
19
-
20
-
21
-
22
-
23
-
24
-
25
-
26
-
27
-
28
-
29
-
30
-
31
-
32
-
33
-
34
-
35
-
36
-
37
-
 38
38 -
 39
39 -
 40
40 -
 41
41 -
 42
42 -
 43
43 -
 44
44 -
 45
45 -
 46
46 -
 47
47 -
 48
48 -
 49
49 -
 50
50 -
 51
51 -
 52
52 -
 53
53 -
 54
54 -
 55
55 -
 56
56 -
 57
57 -
 58
58 -
59
-
60
-
61
-
62
-
63
-
64
-
65
-
66
-
67
-
68
-
69
-
70
-
71
-
72
-
73
-
74
-
75
-
76
-
77
-
78
-
79
-
80
-
81
-
82
-
83
-
84
-
85
-
86
-
87
-
88
-
89
-
90
-
91
-
92
-
93
-
94
-
95
-
96
-
97
-
98
-
99
-
100
-
101
-
102
-
103
-
104
-
105
-
106
-
107
-
108
-
109
-
110
-
111
-
112
-
113
-
114
-
115
-
116
-
117
-
118
-
119
-
120
-
121
-
122
-
123
-
124
-
125
-
126
-
127
-
128
-
129
-
130
-
131
-
132
-
133
-
134
-
135
-
136
-
137
-
138
-
139
-
140
-
141
-
142
-
143
-
144
-
145
-
146
-
147
-
148
-
149
-
150
-
151
-
152
-
153
-
154
-
155
-
156
-
157
-
158
-
159
-
160
-
161
-
162
-
163
-
164
-
165
-
166
-
167
-
168
-
169
-
170
-
171
-
172
-
173
-
174
-
175
-
176
-
177
-
178
-
179
-
180
-
181
-
182
-
183
-
184
-
185
-
186
-
187
-
188
-
189
-
190
-
191
-
192
-
193
-
194
-
195
-
196
-
197
-
198
-
199
-
200
-
201
-
202
-
203
-
204
-
205
-
206
-
207
-
208
-
209
-
210
-
211
-
212
-
213
-
214
-
215
-
216
-
217
-
218
-
219
-
220
-
221
-
222
-
223
-
224
-
225
-
226
-
227
-
228
-
229
-
230
-
231
-
232
-
233
-
234
-
235
-
236
-
237
-
238
-
239
-
240
-
241
-
242
-
243
-
244
-
245
-
246
-
247
-
248
-
249
-
250
-
251
-
252
-
253
-
254
-
255
-
256
-
257
-
258
-
259
-
260
-
261
-
262
-
263
-
264
-
265
-
266
-
267
-
268
-
269
-
270
-
271
-
272
-
273
-
274
-
275
-
276
-
277
-
278
-
279
-
280
-
281
-
282
-
283
-
284
-
285
-
286
-
287
-
288
-
289
-
290
-
291
-
292
-
293
-
294
-
295
-
296
-
297
-
298
-
299
-
300
-
301
-
302
-
303
-
304
-
305
-
306
-
307
-
308
-
309
-
310
-
311
-
312
-
313
-
314
-
315
-
316
-
317
-
318
-
319
-
320
-
321
-
322
-
323
-
324
-
325
-
326
-
327
-
328
-
329
-
330
-
331
-
332
-
333
-
334
-
335
-
336
-
337
-
338
-
339
-
340
-
341
-
342
-
343
-
344
-
345
-
346
-
347
-
348
-
349
-
350
-
351
-
352
-
353
-
354
-
355
-
356
 |
 |

Report on Operations Financial Review – Fiat Group 47
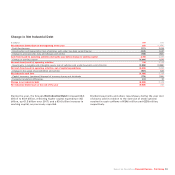
The €3,371 million increase in working capital for 2008 (€3,786
million on a comparable scope of operations and at constant
exchange rates) is largely attributable to reduced business
volumes in the second half, particularly in the 4th quarter
which, for the full year, resulted in an increase in inventories of
approximately €1.5 billion (€2.1 billion on a comparable scope
of operations and at constant exchange rates), principally for
Iveco and CNH. Furthermore, trade payables reduced €1.5
billion from the 2007 year-end level due to lower production
levels.
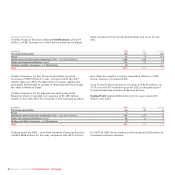
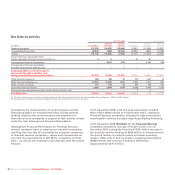
At 31 December 2008, consolidated Net Debt totalled €17,954
million, a €7,531 million increase over the €10,423 million
figure at 31 December 2007, primarily attributable to increased
working capital and portfolio growth for the Financial Services
companies, as discussed previously.
(€ millions) At 31.12.2008 At 31.12.2007
Financial payables (21,379) (17,951)
- Asset-backed financing (6,663) (6,820)
- Other (14,716) (11,131)
Current financial receivables from jointly-controlled financial services entities (a) 381
Financial payables net of intersegment balances and current financial receivables
from jointly controlled financial services entities (21,376) (17,870)
Other financial assets (b) 764 703
Other financial liabilities (b) (1,202) (188)
Other current securities 177 291
Cash and cash equivalents 3,683 6,639
Cash and cash equivalents included under Assets held for sale – 2
Net (Debt)/Cash (17,954) (10,423)
- Industrial Activities (5,949) 355
- Financial Services (12,005) (10,778)
(a) Includes current financial receivables from the joint-venture Fiat Group Automobiles Financial Services - FAFS (now FGA Capital).
(b) Includes assets and liabilities related to recognition of derivative financial instruments at fair value.
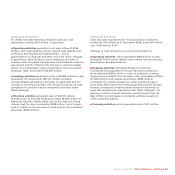
During 2008, Financial Payables were €3,428 million higher.
This was principally attributable to an increase in bank loans.
Liquidity (cash, cash equivalents and current securities -
including amounts reclassified under Assets Held for Sale)
totalled €3,860 million at 31 December 2008, a €3,072
million decrease over the €6,932 million figure at 31
December 2007.
At 31 December 2008, cash and cash equivalents included €473
million (€530 million at 31 December 2007) specifically
allocated to debt servicing for securitisation vehicles, which
are recognised under Asset-Backed Financing.