Chrysler 2008 Annual Report Download - page 278
Download and view the complete annual report
Please find page 278 of the 2008 Chrysler annual report below. You can navigate through the pages in the report by either clicking on the pages listed below, or by using the keyword search tool below to find specific information within the annual report.-
 1
1 -
2
-
3
-
4
-
5
-
6
-
7
-
8
-
9
-
10
-
11
-
12
-
13
-
14
-
15
-
16
-
17
-
18
-
19
-
20
-
21
-
22
-
23
-
24
-
25
-
26
-
27
-
28
-
29
-
30
-
31
-
32
-
33
-
34
-
35
-
36
-
37
-
38
-
39
-
40
-
41
-
42
-
43
-
44
-
45
-
46
-
47
-
48
-
49
-
50
-
51
-
52
-
53
-
54
-
55
-
56
-
57
-
58
-
59
-
60
-
61
-
62
-
63
-
64
-
65
-
66
-
67
-
68
-
69
-
70
-
71
-
72
-
73
-
74
-
75
-
76
-
77
-
78
-
79
-
80
-
81
-
82
-
83
-
84
-
85
-
86
-
87
-
88
-
89
-
90
-
91
-
92
-
93
-
94
-
95
-
96
-
97
-
98
-
99
-
100
-
101
-
102
-
103
-
104
-
105
-
106
-
107
-
108
-
109
-
110
-
111
-
112
-
113
-
114
-
115
-
116
-
117
-
118
-
119
-
120
-
121
-
122
-
123
-
124
-
125
-
126
-
127
-
128
-
129
-
130
-
131
-
132
-
133
-
134
-
135
-
136
-
137
-
138
-
139
-
140
-
141
-
142
-
143
-
144
-
145
-
146
-
147
-
148
-
149
-
150
-
151
-
152
-
153
-
154
-
155
-
156
-
157
-
158
-
159
-
160
-
161
-
162
-
163
-
164
-
165
-
166
-
167
-
168
-
169
-
170
-
171
-
172
-
173
-
174
-
175
-
176
-
177
-
178
-
179
-
180
-
181
-
182
-
183
-
184
-
185
-
186
-
187
-
188
-
189
-
190
-
191
-
192
-
193
-
194
-
195
-
196
-
197
-
198
-
199
-
200
-
201
-
202
-
203
-
204
-
205
-
206
-
207
-
208
-
209
-
210
-
211
-
212
-
213
-
214
-
215
-
216
-
217
-
218
-
219
-
220
-
221
-
222
-
223
-
224
-
225
-
226
-
227
-
228
-
229
-
230
-
231
-
232
-
233
-
234
-
235
-
236
-
237
-
238
-
239
-
240
-
241
-
242
-
243
-
244
-
245
-
246
-
247
-
248
-
249
-
250
-
251
-
252
-
253
-
254
-
255
-
256
-
257
-
258
-
259
-
260
-
261
-
262
-
263
-
264
-
265
-
266
-
267
-
 268
268 -
 269
269 -
 270
270 -
 271
271 -
 272
272 -
 273
273 -
 274
274 -
 275
275 -
 276
276 -
 277
277 -
 278
278 -
 279
279 -
 280
280 -
 281
281 -
 282
282 -
 283
283 -
 284
284 -
 285
285 -
 286
286 -
 287
287 -
 288
288 -
289
-
290
-
291
-
292
-
293
-
294
-
295
-
296
-
297
-
298
-
299
-
300
-
301
-
302
-
303
-
304
-
305
-
306
-
307
-
308
-
309
-
310
-
311
-
312
-
313
-
314
-
315
-
316
-
317
-
318
-
319
-
320
-
321
-
322
-
323
-
324
-
325
-
326
-
327
-
328
-
329
-
330
-
331
-
332
-
333
-
334
-
335
-
336
-
337
-
338
-
339
-
340
-
341
-
342
-
343
-
344
-
345
-
346
-
347
-
348
-
349
-
350
-
351
-
352
-
353
-
354
-
355
-
356
 |
 |

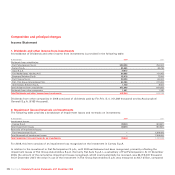
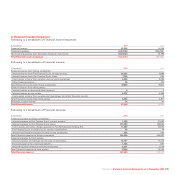
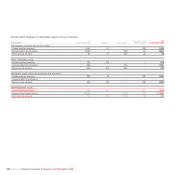
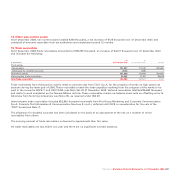
A reconciliation between theoretical income taxes determined on the basis of the tax rates applicable in Italy and the income taxes
reported in the financial statements is as follows:
(€ thousands) 2008 2007
Theoretical income taxes 341,877 639,976
Tax effect of permanent differences (214,402) (608,681)
Taxes relating to prior years 23,428 3,379
Tax loss carryforwards utilised (127,475) –
Unrecognised net deferred tax assets –(163,440)
Current and deferred income tax recognised in the financial statements, excluding IRAP 23,428 (128,766)
IRAP (current and deferred) 20,614 927
Income taxes reported in the Income Statement (current and deferred income taxes) 44,042 (127,839)
Theoretical income taxes are calculated by applying the IRES tax rate (27.5% in 2008 and 33% in 2007) to the result before taxes.
IRAP tax is excluded to facilitate an understanding of the reconciliation between theoretical and reported income taxes; since it is
calculated on a tax basis that differs from profit before taxes, it would otherwise generate distortions between one year and another.
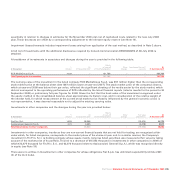
The permanent differences referred to above include, among other things, the tax effect of non-taxable income amounting to
€221,820 thousand in 2008 (€648,850 thousand in 2007) and of non-deductible costs amounting to €7,418 thousand in 2008 (€40,169
thousand in 2007). In particular, in 2008 the tax effect of non-taxable income is principally attributable to dividends and totals
approximately €216,844 thousand (€179,655 thousand in 2007).
Non-deductible costs include impairment losses on investments whose tax effect totalled €1,925 thousand in 2008 (€20,107
thousand in 2007).
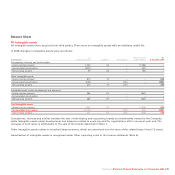
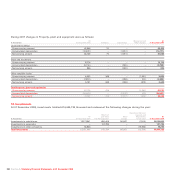
A breakdown of deferred tax liabilities, net of deferred tax assets, is provided in the following table.
At Recognised in At
(€ thousands) 31 December 2007 Income Statement Charged to equity 31 December 2008
Deferred tax assets arising from:
- Taxed provisions and other minor differences 6,632 2,899 – 9,531
Total Deferred tax assets 6,632 2,899 – 9,531
Deferred tax liabilities arising from:
- Measurement of construction contracts by the percentage of completion method (37,172) (4,933) – (42,105)
- Other (1,062) 203 205 (654)
Total Deferred tax liabilities (38,234) (4,730) 205 (42,759)
Theoretical tax benefit arising from tax loss carryforward 175,224 (115,949) – 59,275
Adjustments for assets whose recoverability is not probable (147,878) 116,178 (205) (31,905)
Total Deferred tax liabilities, net of Deferred tax assets (4,256) (1,602) –(5,858)
Fiat S.p.A. Statutory Financial Statements at 31 December 2008 277