Chrysler 2008 Annual Report Download - page 40
Download and view the complete annual report
Please find page 40 of the 2008 Chrysler annual report below. You can navigate through the pages in the report by either clicking on the pages listed below, or by using the keyword search tool below to find specific information within the annual report.-
 1
1 -
2
-
3
-
4
-
5
-
6
-
7
-
8
-
9
-
10
-
11
-
12
-
13
-
14
-
15
-
16
-
17
-
18
-
19
-
20
-
21
-
22
-
23
-
24
-
25
-
26
-
27
-
28
-
29
-
 30
30 -
 31
31 -
 32
32 -
 33
33 -
 34
34 -
 35
35 -
 36
36 -
 37
37 -
 38
38 -
 39
39 -
 40
40 -
 41
41 -
 42
42 -
 43
43 -
 44
44 -
 45
45 -
 46
46 -
 47
47 -
 48
48 -
 49
49 -
 50
50 -
51
-
52
-
53
-
54
-
55
-
56
-
57
-
58
-
59
-
60
-
61
-
62
-
63
-
64
-
65
-
66
-
67
-
68
-
69
-
70
-
71
-
72
-
73
-
74
-
75
-
76
-
77
-
78
-
79
-
80
-
81
-
82
-
83
-
84
-
85
-
86
-
87
-
88
-
89
-
90
-
91
-
92
-
93
-
94
-
95
-
96
-
97
-
98
-
99
-
100
-
101
-
102
-
103
-
104
-
105
-
106
-
107
-
108
-
109
-
110
-
111
-
112
-
113
-
114
-
115
-
116
-
117
-
118
-
119
-
120
-
121
-
122
-
123
-
124
-
125
-
126
-
127
-
128
-
129
-
130
-
131
-
132
-
133
-
134
-
135
-
136
-
137
-
138
-
139
-
140
-
141
-
142
-
143
-
144
-
145
-
146
-
147
-
148
-
149
-
150
-
151
-
152
-
153
-
154
-
155
-
156
-
157
-
158
-
159
-
160
-
161
-
162
-
163
-
164
-
165
-
166
-
167
-
168
-
169
-
170
-
171
-
172
-
173
-
174
-
175
-
176
-
177
-
178
-
179
-
180
-
181
-
182
-
183
-
184
-
185
-
186
-
187
-
188
-
189
-
190
-
191
-
192
-
193
-
194
-
195
-
196
-
197
-
198
-
199
-
200
-
201
-
202
-
203
-
204
-
205
-
206
-
207
-
208
-
209
-
210
-
211
-
212
-
213
-
214
-
215
-
216
-
217
-
218
-
219
-
220
-
221
-
222
-
223
-
224
-
225
-
226
-
227
-
228
-
229
-
230
-
231
-
232
-
233
-
234
-
235
-
236
-
237
-
238
-
239
-
240
-
241
-
242
-
243
-
244
-
245
-
246
-
247
-
248
-
249
-
250
-
251
-
252
-
253
-
254
-
255
-
256
-
257
-
258
-
259
-
260
-
261
-
262
-
263
-
264
-
265
-
266
-
267
-
268
-
269
-
270
-
271
-
272
-
273
-
274
-
275
-
276
-
277
-
278
-
279
-
280
-
281
-
282
-
283
-
284
-
285
-
286
-
287
-
288
-
289
-
290
-
291
-
292
-
293
-
294
-
295
-
296
-
297
-
298
-
299
-
300
-
301
-
302
-
303
-
304
-
305
-
306
-
307
-
308
-
309
-
310
-
311
-
312
-
313
-
314
-
315
-
316
-
317
-
318
-
319
-
320
-
321
-
322
-
323
-
324
-
325
-
326
-
327
-
328
-
329
-
330
-
331
-
332
-
333
-
334
-
335
-
336
-
337
-
338
-
339
-
340
-
341
-
342
-
343
-
344
-
345
-
346
-
347
-
348
-
349
-
350
-
351
-
352
-
353
-
354
-
355
-
356
 |
 |

Report on Operations Financial Review – Fiat Group 39
combine market, CNH substantially maintained market share at
the global level with an increase in Latin America, stable
positions in North America and Western Europe and a slight
decline in the Rest-of-World, due to supply constraints.
Construction equipment unit retail sales decreased 11%
worldwide in 2008. CNH global market share in the
construction equipment was stable at 2007 levels. In the strong
Latin American markets, share gain was achieved in light
equipment while heavy equipment share declined, constrained
by production capacity. In North America and Rest-of-World,
market share was stable in both segments. In the weak Western
European market, share declined slightly in both heavy and
light equipment due to the decision to preserve margins.
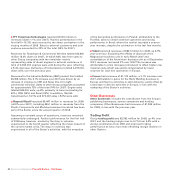
Trucks and Commercial Vehicles
For 2008, Iveco reported revenues of €10,768 million,
representing a 3.8% year-over-year decrease, mainly due to
lower sales volumes in Europe. Volumes decreased
significantly in the second half compared to the first.
Iveco delivered 192,143 vehicles, a decrease of 9.2% over 2007.
In Western Europe, 125,152 vehicles were delivered, down
15.1% year-over-year. Declines were experienced in all principal
European markets, particularly Italy (-19.4%), Spain (-37.5%),
Germany (-14.2%), France (-5.7%) and Great Britain (-3.2%). In
Eastern Europe, deliveries contracted by 5.4%. There was
particularly positive performance, however, in Latin America
(+21.6%), where the significant growth experienced in the first
nine months of the year (+42%) was followed by a sharp
decline in the fourth quarter as a result of the financial crisis
beginning to impact the Brazilian market.
Iveco’s market share in Western Europe (GVW >_ 2.8 ton) stood
at 9.9%, 0.5 percentage points lower than 2007. Market share in
the light vehicle segment decreased 0.3 percentage points, with
increased demand in the “van” segment being predominantly
met by car-based models. Market share in the medium segment
fell 1.3 percentage points, principally due to low-priced
competition. Market share for the heavy segment decreased
one percentage point. Overall performance in all three
segments reflected a less favourable market mix than for 2007.
Iveco’s market share in Eastern Europe (GVW >_ 2.8 ton) stood
at 11.8% (-0.4 percentage points over 2007), with share holding
steady for light and heavy vehicles and declining slightly for
medium vehicles.
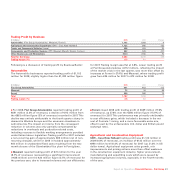
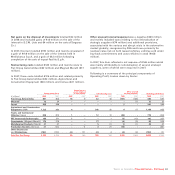
Components and Production Systems
Components and Production Systems posted revenues of
€13,793 million. The 3.1% increase principally reflects changes in
the scope of consolidation at Magneti Marelli (+8.9% in absolute
terms, but in line with 2007 on a like-for-like basis) and Teksid
(+3% on a comparable basis). There was revenue increase at
Comau (+3.1%), whereas FPT Powertrain Technologies closed the
year substantially in line with the previous year.
(€ millions) 2008 2007 % change
FPT Powertrain Technologies 7,000 7,075 -1.1
Components (Magneti Marelli) 5,447 5,000 8.9
Metallurgical Products (Teksid) 837 783 6.9
Production Systems (Comau) 1,123 1,089 3.1
Eliminations (614) (572) –
Total 13,793 13,375 3.1