Chrysler 2008 Annual Report Download - page 38
Download and view the complete annual report
Please find page 38 of the 2008 Chrysler annual report below. You can navigate through the pages in the report by either clicking on the pages listed below, or by using the keyword search tool below to find specific information within the annual report.-
 1
1 -
2
-
3
-
4
-
5
-
6
-
7
-
8
-
9
-
10
-
11
-
12
-
13
-
14
-
15
-
16
-
17
-
18
-
19
-
20
-
21
-
22
-
23
-
24
-
25
-
26
-
27
-
 28
28 -
 29
29 -
 30
30 -
 31
31 -
 32
32 -
 33
33 -
 34
34 -
 35
35 -
 36
36 -
 37
37 -
 38
38 -
 39
39 -
 40
40 -
 41
41 -
 42
42 -
 43
43 -
 44
44 -
 45
45 -
 46
46 -
 47
47 -
 48
48 -
49
-
50
-
51
-
52
-
53
-
54
-
55
-
56
-
57
-
58
-
59
-
60
-
61
-
62
-
63
-
64
-
65
-
66
-
67
-
68
-
69
-
70
-
71
-
72
-
73
-
74
-
75
-
76
-
77
-
78
-
79
-
80
-
81
-
82
-
83
-
84
-
85
-
86
-
87
-
88
-
89
-
90
-
91
-
92
-
93
-
94
-
95
-
96
-
97
-
98
-
99
-
100
-
101
-
102
-
103
-
104
-
105
-
106
-
107
-
108
-
109
-
110
-
111
-
112
-
113
-
114
-
115
-
116
-
117
-
118
-
119
-
120
-
121
-
122
-
123
-
124
-
125
-
126
-
127
-
128
-
129
-
130
-
131
-
132
-
133
-
134
-
135
-
136
-
137
-
138
-
139
-
140
-
141
-
142
-
143
-
144
-
145
-
146
-
147
-
148
-
149
-
150
-
151
-
152
-
153
-
154
-
155
-
156
-
157
-
158
-
159
-
160
-
161
-
162
-
163
-
164
-
165
-
166
-
167
-
168
-
169
-
170
-
171
-
172
-
173
-
174
-
175
-
176
-
177
-
178
-
179
-
180
-
181
-
182
-
183
-
184
-
185
-
186
-
187
-
188
-
189
-
190
-
191
-
192
-
193
-
194
-
195
-
196
-
197
-
198
-
199
-
200
-
201
-
202
-
203
-
204
-
205
-
206
-
207
-
208
-
209
-
210
-
211
-
212
-
213
-
214
-
215
-
216
-
217
-
218
-
219
-
220
-
221
-
222
-
223
-
224
-
225
-
226
-
227
-
228
-
229
-
230
-
231
-
232
-
233
-
234
-
235
-
236
-
237
-
238
-
239
-
240
-
241
-
242
-
243
-
244
-
245
-
246
-
247
-
248
-
249
-
250
-
251
-
252
-
253
-
254
-
255
-
256
-
257
-
258
-
259
-
260
-
261
-
262
-
263
-
264
-
265
-
266
-
267
-
268
-
269
-
270
-
271
-
272
-
273
-
274
-
275
-
276
-
277
-
278
-
279
-
280
-
281
-
282
-
283
-
284
-
285
-
286
-
287
-
288
-
289
-
290
-
291
-
292
-
293
-
294
-
295
-
296
-
297
-
298
-
299
-
300
-
301
-
302
-
303
-
304
-
305
-
306
-
307
-
308
-
309
-
310
-
311
-
312
-
313
-
314
-
315
-
316
-
317
-
318
-
319
-
320
-
321
-
322
-
323
-
324
-
325
-
326
-
327
-
328
-
329
-
330
-
331
-
332
-
333
-
334
-
335
-
336
-
337
-
338
-
339
-
340
-
341
-
342
-
343
-
344
-
345
-
346
-
347
-
348
-
349
-
350
-
351
-
352
-
353
-
354
-
355
-
356
 |
 |

Report on Operations Financial Review – Fiat Group 37
Net revenues
Group revenues for 2008 totalled €59,380 million, up 1.5% year-
over-year. A positive performance in the first half (+10.9%) was
followed by a slowdown in demand in the third quarter and a
progressively significant decline in volumes in the closing
months of 2008.
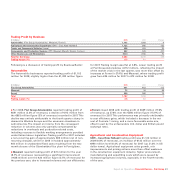
Financial Review
Operating Performance
(€ millions) 2008 2007
Net revenues 59,380 58,529
Cost of sales 49,423 48,924
Selling, general and administrative 5,075 4,924
Research and development 1,497 1,536
Other income/(expense) (23) 88
Trading profit 3,362 3,233
Gains/(losses) on disposal of investments 20 190
Restructuring costs 165 105
Other unusual income/(expense) (245) (166)
Operating profit 2,972 3,152
Financial income/(expense) (947) (564)
Result from investments 162 185
- Net result of investees accounted for using the equity method 133 210
- Other income/(expense) from investments 29 (25)
Profit before taxes 2,187 2,773
Income taxes 466 719
Profit from continuing operations 1,721 2,054
Profit from discontinued operations ––
Net profit for the year 1,721 2,054
Attributable to:
Equity holders of the Parent 1,612 1,953
Minority interests 109 101
In the following review, net revenues and trading profit are
discussed by individual Business/Sector. Other data relates to
the Group as a whole.
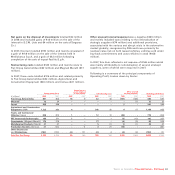
Revenues by Business
(€ millions) 2008 2007 % change
Automobiles (Fiat Group Automobiles, Maserati, Ferrari) 29,380 29,015 1.3
Agricultural and Construction Equipment (CNH – Case New Holland) 12,723 11,843 7.4
Trucks and Commercial Vehicles (Iveco) 10,768 11,196 -3.8
Components and Production Systems (FPT, Magneti Marelli, Teksid, Comau) 13,793 13,375 3.1
Other Businesses 1,394 1,374 1.5
Eliminations (8,678) (8,274) –
Total for the Group 59,380 58,529 1.5