Chrysler 2008 Annual Report Download - page 159
Download and view the complete annual report
Please find page 159 of the 2008 Chrysler annual report below. You can navigate through the pages in the report by either clicking on the pages listed below, or by using the keyword search tool below to find specific information within the annual report.-
 1
1 -
2
-
3
-
4
-
5
-
6
-
7
-
8
-
9
-
10
-
11
-
12
-
13
-
14
-
15
-
16
-
17
-
18
-
19
-
20
-
21
-
22
-
23
-
24
-
25
-
26
-
27
-
28
-
29
-
30
-
31
-
32
-
33
-
34
-
35
-
36
-
37
-
38
-
39
-
40
-
41
-
42
-
43
-
44
-
45
-
46
-
47
-
48
-
49
-
50
-
51
-
52
-
53
-
54
-
55
-
56
-
57
-
58
-
59
-
60
-
61
-
62
-
63
-
64
-
65
-
66
-
67
-
68
-
69
-
70
-
71
-
72
-
73
-
74
-
75
-
76
-
77
-
78
-
79
-
80
-
81
-
82
-
83
-
84
-
85
-
86
-
87
-
88
-
89
-
90
-
91
-
92
-
93
-
94
-
95
-
96
-
97
-
98
-
99
-
100
-
101
-
102
-
103
-
104
-
105
-
106
-
107
-
108
-
109
-
110
-
111
-
112
-
113
-
114
-
115
-
116
-
117
-
118
-
119
-
120
-
121
-
122
-
123
-
124
-
125
-
126
-
127
-
128
-
129
-
130
-
131
-
132
-
133
-
134
-
135
-
136
-
137
-
138
-
139
-
140
-
141
-
142
-
143
-
144
-
145
-
146
-
147
-
148
-
 149
149 -
 150
150 -
 151
151 -
 152
152 -
 153
153 -
 154
154 -
 155
155 -
 156
156 -
 157
157 -
 158
158 -
 159
159 -
 160
160 -
 161
161 -
 162
162 -
 163
163 -
 164
164 -
 165
165 -
 166
166 -
 167
167 -
 168
168 -
 169
169 -
170
-
171
-
172
-
173
-
174
-
175
-
176
-
177
-
178
-
179
-
180
-
181
-
182
-
183
-
184
-
185
-
186
-
187
-
188
-
189
-
190
-
191
-
192
-
193
-
194
-
195
-
196
-
197
-
198
-
199
-
200
-
201
-
202
-
203
-
204
-
205
-
206
-
207
-
208
-
209
-
210
-
211
-
212
-
213
-
214
-
215
-
216
-
217
-
218
-
219
-
220
-
221
-
222
-
223
-
224
-
225
-
226
-
227
-
228
-
229
-
230
-
231
-
232
-
233
-
234
-
235
-
236
-
237
-
238
-
239
-
240
-
241
-
242
-
243
-
244
-
245
-
246
-
247
-
248
-
249
-
250
-
251
-
252
-
253
-
254
-
255
-
256
-
257
-
258
-
259
-
260
-
261
-
262
-
263
-
264
-
265
-
266
-
267
-
268
-
269
-
270
-
271
-
272
-
273
-
274
-
275
-
276
-
277
-
278
-
279
-
280
-
281
-
282
-
283
-
284
-
285
-
286
-
287
-
288
-
289
-
290
-
291
-
292
-
293
-
294
-
295
-
296
-
297
-
298
-
299
-
300
-
301
-
302
-
303
-
304
-
305
-
306
-
307
-
308
-
309
-
310
-
311
-
312
-
313
-
314
-
315
-
316
-
317
-
318
-
319
-
320
-
321
-
322
-
323
-
324
-
325
-
326
-
327
-
328
-
329
-
330
-
331
-
332
-
333
-
334
-
335
-
336
-
337
-
338
-
339
-
340
-
341
-
342
-
343
-
344
-
345
-
346
-
347
-
348
-
349
-
350
-
351
-
352
-
353
-
354
-
355
-
356
 |
 |

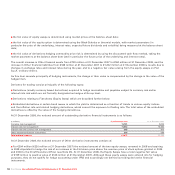
the fair value of equity swaps is determined using market prices at the balance sheet date;
the fair value of the equity option is determined using the Black-Scholes or binomial models, with market parameters (in
particular the price of the underlying, interest rates, expected future dividends and volatility) being measured at the balance sheet
date;
the fair value of derivatives hedging commodity price risk is determined by using the discounted cash flow method, taking the
market parameters at the balance sheet date (and in particular the future price of the underlying and interest rates).
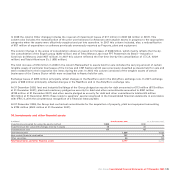
The overall increase in Other financial assets from €703 million at 31 December 2007 to €764 million at 31 December 2008, and the
increase in Other financial liabilities from €188 million at 31 December 2007 to €1,202 million at 31 December 2008 is mostly due to
changes in exchange rates and interest rates during the year, and to a negative fair value arising from the equity swaps on Fiat
S.p.A. ordinary shares.
As this item consists principally of hedging instruments, the change in their value is compensated by the change in the value of the
hedged item.
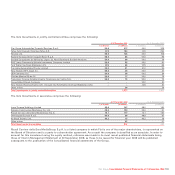
Derivates for trading consist principally of the following types:
Derivatives (mostly currency based derivatives) acquired to hedge receivables and payables subject to currency risk and/or
interest rate risk which are not formally designated as hedges at Group level.
Derivatives relating to Fiat shares (Equity Swap) which are described further below.
Embedded derivatives in certain bond issues in which the yield is determined as a function of trends in various equity indices
and the inflation rate and related hedging derivatives, which convert the exposure to floating rate. The total value of the embedded
derivatives is offset by the value of the hedging derivatives.
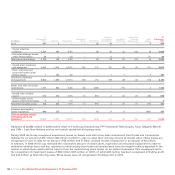
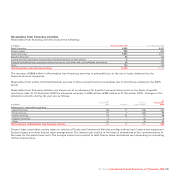
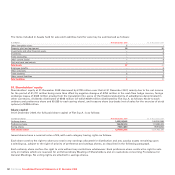
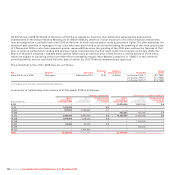
At 31 December 2008, the notional amount of outstanding derivative financial instruments is as follows:
(€ millions) At 31 December 2008 At 31 December 2007
Currency risk management 11,791 9,074
Interest rate risk management 11,382 10,634
Interest rate and currency risk management 965 913
Other derivative financial instruments 334 538
Total notional amount 24,472 21,159
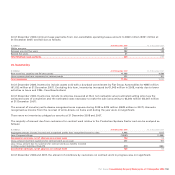
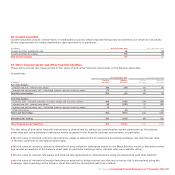
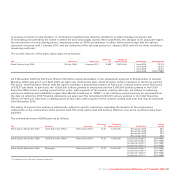
At 31 December 2008, the notional amount of Other derivative instruments consists of:
For €204 million (€220 million at 31 December 2007) the notional amount of the two equity swaps, renewed in 2008 and expiring
in 2009 stipulated to hedge the risk of an increase in the Fiat share price above the exercise price of stock options granted in 2004
and 2006 to the Chief Executive Officer (see Note 25). At 31 December 2008, the Equity Swaps have a total negative fair value
of €109 million (a positive value of €146 million at 31 December 2007). Although these equity swaps were entered into for hedging
purposes, they do not qualify for hedge accounting under IFRS and accordingly are defined as trading derivative financial
instruments.
Fiat Group Consolidated Financial Statements at 31 December 2008158