Chrysler 2008 Annual Report Download - page 178
Download and view the complete annual report
Please find page 178 of the 2008 Chrysler annual report below. You can navigate through the pages in the report by either clicking on the pages listed below, or by using the keyword search tool below to find specific information within the annual report.-
 1
1 -
2
-
3
-
4
-
5
-
6
-
7
-
8
-
9
-
10
-
11
-
12
-
13
-
14
-
15
-
16
-
17
-
18
-
19
-
20
-
21
-
22
-
23
-
24
-
25
-
26
-
27
-
28
-
29
-
30
-
31
-
32
-
33
-
34
-
35
-
36
-
37
-
38
-
39
-
40
-
41
-
42
-
43
-
44
-
45
-
46
-
47
-
48
-
49
-
50
-
51
-
52
-
53
-
54
-
55
-
56
-
57
-
58
-
59
-
60
-
61
-
62
-
63
-
64
-
65
-
66
-
67
-
68
-
69
-
70
-
71
-
72
-
73
-
74
-
75
-
76
-
77
-
78
-
79
-
80
-
81
-
82
-
83
-
84
-
85
-
86
-
87
-
88
-
89
-
90
-
91
-
92
-
93
-
94
-
95
-
96
-
97
-
98
-
99
-
100
-
101
-
102
-
103
-
104
-
105
-
106
-
107
-
108
-
109
-
110
-
111
-
112
-
113
-
114
-
115
-
116
-
117
-
118
-
119
-
120
-
121
-
122
-
123
-
124
-
125
-
126
-
127
-
128
-
129
-
130
-
131
-
132
-
133
-
134
-
135
-
136
-
137
-
138
-
139
-
140
-
141
-
142
-
143
-
144
-
145
-
146
-
147
-
148
-
149
-
150
-
151
-
152
-
153
-
154
-
155
-
156
-
157
-
158
-
159
-
160
-
161
-
162
-
163
-
164
-
165
-
166
-
167
-
 168
168 -
 169
169 -
 170
170 -
 171
171 -
 172
172 -
 173
173 -
 174
174 -
 175
175 -
 176
176 -
 177
177 -
 178
178 -
 179
179 -
 180
180 -
 181
181 -
 182
182 -
 183
183 -
 184
184 -
 185
185 -
 186
186 -
 187
187 -
 188
188 -
189
-
190
-
191
-
192
-
193
-
194
-
195
-
196
-
197
-
198
-
199
-
200
-
201
-
202
-
203
-
204
-
205
-
206
-
207
-
208
-
209
-
210
-
211
-
212
-
213
-
214
-
215
-
216
-
217
-
218
-
219
-
220
-
221
-
222
-
223
-
224
-
225
-
226
-
227
-
228
-
229
-
230
-
231
-
232
-
233
-
234
-
235
-
236
-
237
-
238
-
239
-
240
-
241
-
242
-
243
-
244
-
245
-
246
-
247
-
248
-
249
-
250
-
251
-
252
-
253
-
254
-
255
-
256
-
257
-
258
-
259
-
260
-
261
-
262
-
263
-
264
-
265
-
266
-
267
-
268
-
269
-
270
-
271
-
272
-
273
-
274
-
275
-
276
-
277
-
278
-
279
-
280
-
281
-
282
-
283
-
284
-
285
-
286
-
287
-
288
-
289
-
290
-
291
-
292
-
293
-
294
-
295
-
296
-
297
-
298
-
299
-
300
-
301
-
302
-
303
-
304
-
305
-
306
-
307
-
308
-
309
-
310
-
311
-
312
-
313
-
314
-
315
-
316
-
317
-
318
-
319
-
320
-
321
-
322
-
323
-
324
-
325
-
326
-
327
-
328
-
329
-
330
-
331
-
332
-
333
-
334
-
335
-
336
-
337
-
338
-
339
-
340
-
341
-
342
-
343
-
344
-
345
-
346
-
347
-
348
-
349
-
350
-
351
-
352
-
353
-
354
-
355
-
356
 |
 |

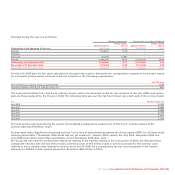
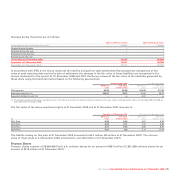
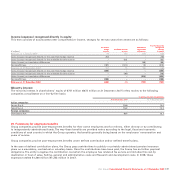
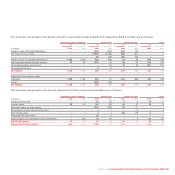
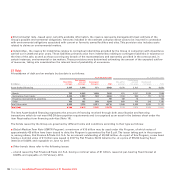
Income (expense) recognised directly in equity
This item consists of accumulated other comprehensive income, changes for the two years then ended are as follows:
Income (expense)
Cash flow Cumulative recognised
hedge Available-for-sale translation directly
(€ millions) reserve reserve differences in equity
Balances at 1 January 2007 76 170 294 540
Gains (losses) recognised directly in the cash flow hedge reserve 262 – – 262
Gains (losses) recognised directly in the available-for-sale reserve – (32) – (32)
Gains (losses) on translation differences – – (96) (96)
Net (profit) loss (187) (123) (2) (312)
Balances at 31 December 2007 151 15 196 362
Gains (losses) recognised directly in the cash flow hedge reserve (455) – – (455)
Gains (losses) recognised directly in the available-for-sale reserve – (16) – (16)
Gains (losses) on translation differences – – (328) (328)
Net (profit) loss (295) – – (295)
Balances at 31 December 2008 (599) (1) (132) (732)
Minority interest
The minority interest in shareholders’ equity of €747 million (€673 million at 31 December 2007) refers mainly to the following
companies consolidated on a line-by-line basis:
% held by minority shareholders
At 31 December 2008 At 31 December 2007
Italian companies:
Ferrari S.p.A. 15.0 15.0
Teksid S.p.A. 15.2 15.2
Foreign companies:
CNH Global N.V. 10.7 10.7
25. Provisions for employee benefits
Group companies provide post-employment benefits for their active employees and for retirees, either directly or by contributing
to independently administered funds. The way these benefits are provided varies according to the legal, fiscal and economic
conditions of each country in which the Group operates, the benefits generally being based on the employees’ remuneration and
years of service.
Group companies provide post-employment benefits under defined contribution and/or defined benefit plans.
In the case of defined contribution plans, the Group pays contributions to publicly or privately administered pension insurance
plans on a mandatory, contractual or voluntary basis. Once the contributions have been paid, the Group has no further payment
obligations. The entity recognise the contribution cost when the employee has rendered his service and includes this cost by
destination in Cost of sales, Selling, general and administrative costs and Research and development costs. In 2008, these
expenses totalled €1,366 million (€1,243 million in 2007).
Fiat Group Consolidated Financial Statements at 31 December 2008 177