Chrysler 2008 Annual Report Download - page 170
Download and view the complete annual report
Please find page 170 of the 2008 Chrysler annual report below. You can navigate through the pages in the report by either clicking on the pages listed below, or by using the keyword search tool below to find specific information within the annual report.-
 1
1 -
2
-
3
-
4
-
5
-
6
-
7
-
8
-
9
-
10
-
11
-
12
-
13
-
14
-
15
-
16
-
17
-
18
-
19
-
20
-
21
-
22
-
23
-
24
-
25
-
26
-
27
-
28
-
29
-
30
-
31
-
32
-
33
-
34
-
35
-
36
-
37
-
38
-
39
-
40
-
41
-
42
-
43
-
44
-
45
-
46
-
47
-
48
-
49
-
50
-
51
-
52
-
53
-
54
-
55
-
56
-
57
-
58
-
59
-
60
-
61
-
62
-
63
-
64
-
65
-
66
-
67
-
68
-
69
-
70
-
71
-
72
-
73
-
74
-
75
-
76
-
77
-
78
-
79
-
80
-
81
-
82
-
83
-
84
-
85
-
86
-
87
-
88
-
89
-
90
-
91
-
92
-
93
-
94
-
95
-
96
-
97
-
98
-
99
-
100
-
101
-
102
-
103
-
104
-
105
-
106
-
107
-
108
-
109
-
110
-
111
-
112
-
113
-
114
-
115
-
116
-
117
-
118
-
119
-
120
-
121
-
122
-
123
-
124
-
125
-
126
-
127
-
128
-
129
-
130
-
131
-
132
-
133
-
134
-
135
-
136
-
137
-
138
-
139
-
140
-
141
-
142
-
143
-
144
-
145
-
146
-
147
-
148
-
149
-
150
-
151
-
152
-
153
-
154
-
155
-
156
-
157
-
158
-
159
-
 160
160 -
 161
161 -
 162
162 -
 163
163 -
 164
164 -
 165
165 -
 166
166 -
 167
167 -
 168
168 -
 169
169 -
 170
170 -
 171
171 -
 172
172 -
 173
173 -
 174
174 -
 175
175 -
 176
176 -
 177
177 -
 178
178 -
 179
179 -
 180
180 -
181
-
182
-
183
-
184
-
185
-
186
-
187
-
188
-
189
-
190
-
191
-
192
-
193
-
194
-
195
-
196
-
197
-
198
-
199
-
200
-
201
-
202
-
203
-
204
-
205
-
206
-
207
-
208
-
209
-
210
-
211
-
212
-
213
-
214
-
215
-
216
-
217
-
218
-
219
-
220
-
221
-
222
-
223
-
224
-
225
-
226
-
227
-
228
-
229
-
230
-
231
-
232
-
233
-
234
-
235
-
236
-
237
-
238
-
239
-
240
-
241
-
242
-
243
-
244
-
245
-
246
-
247
-
248
-
249
-
250
-
251
-
252
-
253
-
254
-
255
-
256
-
257
-
258
-
259
-
260
-
261
-
262
-
263
-
264
-
265
-
266
-
267
-
268
-
269
-
270
-
271
-
272
-
273
-
274
-
275
-
276
-
277
-
278
-
279
-
280
-
281
-
282
-
283
-
284
-
285
-
286
-
287
-
288
-
289
-
290
-
291
-
292
-
293
-
294
-
295
-
296
-
297
-
298
-
299
-
300
-
301
-
302
-
303
-
304
-
305
-
306
-
307
-
308
-
309
-
310
-
311
-
312
-
313
-
314
-
315
-
316
-
317
-
318
-
319
-
320
-
321
-
322
-
323
-
324
-
325
-
326
-
327
-
328
-
329
-
330
-
331
-
332
-
333
-
334
-
335
-
336
-
337
-
338
-
339
-
340
-
341
-
342
-
343
-
344
-
345
-
346
-
347
-
348
-
349
-
350
-
351
-
352
-
353
-
354
-
355
-
356
 |
 |

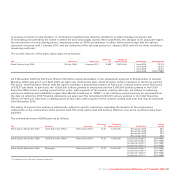
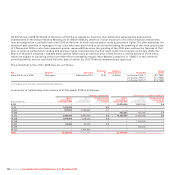
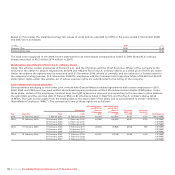
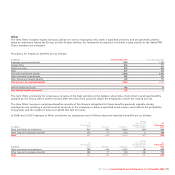
Changes during the year are as follows:
Managers compensation Compensation as member of the Board
Average exercise Average exercise
Number of options price (€) Number of options price (€)
Outstanding at the beginning of the year 13,021,500 14.65 22,420,000 10.72
Granted 1,418,500 10.24 – –
Forfeited ––––
Exercised (71,000) 10.397 – –
Expired (1,442,000) 24.22 (1,250,000) 24.06
Outstanding at 31 December 2008 12,927,000 13.11 21,170,000 9.93
Exercisable at 31 December 2008 2,015,500 13.93 11,170,000 6.86
Exercisable at 31 December 2007 3,229,000 18.52 1,750,000 20.81
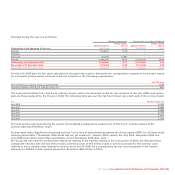
For the July 2008 plan the fair value calculated at the grant date used to determine the compensation expense to be accrued, based
on a binomial pricing model, amounts to €4 and is based on the following assumptions:
July 2008 grant
Price of Fiat S.p.A. ordinary shares at grant date (€) 11.43
Historical volatility of Fiat S.p.A. ordinary shares (%) 44.2
The expected dividends from Fiat S.p.A. ordinary shares used in the binomial model for the valuation of the July 2008 stock option
plan are those declared by the Group in 2006. The following table sets out the risk-free interest rate yield used in the pricing model:
in % Risk-free interest rate
July 2009 5.3182
July 2010 5.2981
July 2011 5.2686
July 2012 5.2173
July 2013 5.1617
July 2014 5.1174
For stock options exercised during the period, the weighted average stock market price of Fiat S.p.A. ordinary shares at the
exercise date was €13.99 per share.
As discussed under Significant accounting policies, in the case of share-based payments the Group applies IFRS 2 to all those stock
options granted after 7 November 2002 which had not yet vested at 1 January 2005, namely the July 2004, November 2006 and
July 2008 stock option plans. More specifically, for the November 2006 plan, since
the Group did not reach the performance objectives relating to the tranche vesting in the first quarter of 2009, the likelihood that
subsequent tranches will vest has been revised, and the accrual of €18 million made in previous periods for the nominal costs
relating to those tranches was released to income at the end of 2008. As a consequence the net cost recognised in the income
statement in 2008 for stock options amounts to €3 million (€66 million in 2007).
Fiat Group Consolidated Financial Statements at 31 December 2008 169