Chrysler 2008 Annual Report Download - page 51
Download and view the complete annual report
Please find page 51 of the 2008 Chrysler annual report below. You can navigate through the pages in the report by either clicking on the pages listed below, or by using the keyword search tool below to find specific information within the annual report.-
 1
1 -
2
-
3
-
4
-
5
-
6
-
7
-
8
-
9
-
10
-
11
-
12
-
13
-
14
-
15
-
16
-
17
-
18
-
19
-
20
-
21
-
22
-
23
-
24
-
25
-
26
-
27
-
28
-
29
-
30
-
31
-
32
-
33
-
34
-
35
-
36
-
37
-
38
-
39
-
40
-
 41
41 -
 42
42 -
 43
43 -
 44
44 -
 45
45 -
 46
46 -
 47
47 -
 48
48 -
 49
49 -
 50
50 -
 51
51 -
 52
52 -
 53
53 -
 54
54 -
 55
55 -
 56
56 -
 57
57 -
 58
58 -
 59
59 -
 60
60 -
 61
61 -
62
-
63
-
64
-
65
-
66
-
67
-
68
-
69
-
70
-
71
-
72
-
73
-
74
-
75
-
76
-
77
-
78
-
79
-
80
-
81
-
82
-
83
-
84
-
85
-
86
-
87
-
88
-
89
-
90
-
91
-
92
-
93
-
94
-
95
-
96
-
97
-
98
-
99
-
100
-
101
-
102
-
103
-
104
-
105
-
106
-
107
-
108
-
109
-
110
-
111
-
112
-
113
-
114
-
115
-
116
-
117
-
118
-
119
-
120
-
121
-
122
-
123
-
124
-
125
-
126
-
127
-
128
-
129
-
130
-
131
-
132
-
133
-
134
-
135
-
136
-
137
-
138
-
139
-
140
-
141
-
142
-
143
-
144
-
145
-
146
-
147
-
148
-
149
-
150
-
151
-
152
-
153
-
154
-
155
-
156
-
157
-
158
-
159
-
160
-
161
-
162
-
163
-
164
-
165
-
166
-
167
-
168
-
169
-
170
-
171
-
172
-
173
-
174
-
175
-
176
-
177
-
178
-
179
-
180
-
181
-
182
-
183
-
184
-
185
-
186
-
187
-
188
-
189
-
190
-
191
-
192
-
193
-
194
-
195
-
196
-
197
-
198
-
199
-
200
-
201
-
202
-
203
-
204
-
205
-
206
-
207
-
208
-
209
-
210
-
211
-
212
-
213
-
214
-
215
-
216
-
217
-
218
-
219
-
220
-
221
-
222
-
223
-
224
-
225
-
226
-
227
-
228
-
229
-
230
-
231
-
232
-
233
-
234
-
235
-
236
-
237
-
238
-
239
-
240
-
241
-
242
-
243
-
244
-
245
-
246
-
247
-
248
-
249
-
250
-
251
-
252
-
253
-
254
-
255
-
256
-
257
-
258
-
259
-
260
-
261
-
262
-
263
-
264
-
265
-
266
-
267
-
268
-
269
-
270
-
271
-
272
-
273
-
274
-
275
-
276
-
277
-
278
-
279
-
280
-
281
-
282
-
283
-
284
-
285
-
286
-
287
-
288
-
289
-
290
-
291
-
292
-
293
-
294
-
295
-
296
-
297
-
298
-
299
-
300
-
301
-
302
-
303
-
304
-
305
-
306
-
307
-
308
-
309
-
310
-
311
-
312
-
313
-
314
-
315
-
316
-
317
-
318
-
319
-
320
-
321
-
322
-
323
-
324
-
325
-
326
-
327
-
328
-
329
-
330
-
331
-
332
-
333
-
334
-
335
-
336
-
337
-
338
-
339
-
340
-
341
-
342
-
343
-
344
-
345
-
346
-
347
-
348
-
349
-
350
-
351
-
352
-
353
-
354
-
355
-
356
 |
 |

Report on Operations Financial Review – Fiat Group50
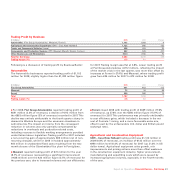
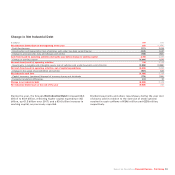
Financial Services for Fiat Group Automobiles reported
revenues of €160 million for year, compared with the €127
million figure for 2007. The €33 million increase (+26%) was
principally attributable to growth in financing activity through
the sales network in Brazil.
Financial Services for the Agricultural and Construction
Equipment Sector reported net revenues of €1,169 million,
largely in line with 2007. The increase in the managed portfolio
was offset by negative currency translation effects (in USD
terms, revenues increased 8.2%).
Iveco Financial Services had net revenues of €137 million, up
17.1% over the €117 million figure for 2007, principally due to
increased business volumes in Eastern Europe.
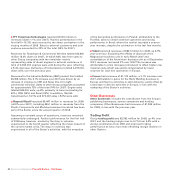
Trading Profit totalled €324 million for the year, down €15
million over 2007.
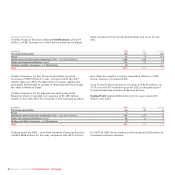
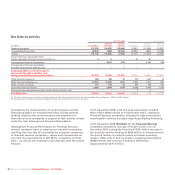
Financial Services
In 2008, Financial Services achieved Net Revenues of €1,477
million, a 4.8% increase over 2007, driven primarily by higher
sales volumes for Fiat Group Automobiles and Iveco for the
year.
(€ millions) 2008 2007 % change
Fiat Group Automobiles 160 127 26.0
Ferrari 14 8 75.0
Agricultural and Construction Equipment (CNH – Case New Holland) 1,169 1,158 0.9
Trucks and Commercial Vehicles (Iveco) 137 11 7 1 7. 1
Holding and Other Companies, and Eliminations (3) – n.a.
Total 1,477 1,410 4.8
(€ millions) 2008 2007 Change
Fiat Group Automobiles 40 49 -9
Ferrari 2–2
Agricultural and Construction Equipment (CNH – Case New Holland) 265 277 -12
Trucks and Commercial Vehicles (Iveco) 18 13 5
Holding and Other Companies, and Eliminations (1) –-1
Total 324 339 -15
Trading profit for CNH – Case New Holland’s Financial Services
totalled €265 million for the year, compared with €277 million
for 2007. In USD terms, trading profit increased 2.6% driven by
increased business volumes.