Chrysler 2008 Annual Report Download - page 136
Download and view the complete annual report
Please find page 136 of the 2008 Chrysler annual report below. You can navigate through the pages in the report by either clicking on the pages listed below, or by using the keyword search tool below to find specific information within the annual report.-
 1
1 -
2
-
3
-
4
-
5
-
6
-
7
-
8
-
9
-
10
-
11
-
12
-
13
-
14
-
15
-
16
-
17
-
18
-
19
-
20
-
21
-
22
-
23
-
24
-
25
-
26
-
27
-
28
-
29
-
30
-
31
-
32
-
33
-
34
-
35
-
36
-
37
-
38
-
39
-
40
-
41
-
42
-
43
-
44
-
45
-
46
-
47
-
48
-
49
-
50
-
51
-
52
-
53
-
54
-
55
-
56
-
57
-
58
-
59
-
60
-
61
-
62
-
63
-
64
-
65
-
66
-
67
-
68
-
69
-
70
-
71
-
72
-
73
-
74
-
75
-
76
-
77
-
78
-
79
-
80
-
81
-
82
-
83
-
84
-
85
-
86
-
87
-
88
-
89
-
90
-
91
-
92
-
93
-
94
-
95
-
96
-
97
-
98
-
99
-
100
-
101
-
102
-
103
-
104
-
105
-
106
-
107
-
108
-
109
-
110
-
111
-
112
-
113
-
114
-
115
-
116
-
117
-
118
-
119
-
120
-
121
-
122
-
123
-
124
-
125
-
 126
126 -
 127
127 -
 128
128 -
 129
129 -
 130
130 -
 131
131 -
 132
132 -
 133
133 -
 134
134 -
 135
135 -
 136
136 -
 137
137 -
 138
138 -
 139
139 -
 140
140 -
 141
141 -
 142
142 -
 143
143 -
 144
144 -
 145
145 -
 146
146 -
147
-
148
-
149
-
150
-
151
-
152
-
153
-
154
-
155
-
156
-
157
-
158
-
159
-
160
-
161
-
162
-
163
-
164
-
165
-
166
-
167
-
168
-
169
-
170
-
171
-
172
-
173
-
174
-
175
-
176
-
177
-
178
-
179
-
180
-
181
-
182
-
183
-
184
-
185
-
186
-
187
-
188
-
189
-
190
-
191
-
192
-
193
-
194
-
195
-
196
-
197
-
198
-
199
-
200
-
201
-
202
-
203
-
204
-
205
-
206
-
207
-
208
-
209
-
210
-
211
-
212
-
213
-
214
-
215
-
216
-
217
-
218
-
219
-
220
-
221
-
222
-
223
-
224
-
225
-
226
-
227
-
228
-
229
-
230
-
231
-
232
-
233
-
234
-
235
-
236
-
237
-
238
-
239
-
240
-
241
-
242
-
243
-
244
-
245
-
246
-
247
-
248
-
249
-
250
-
251
-
252
-
253
-
254
-
255
-
256
-
257
-
258
-
259
-
260
-
261
-
262
-
263
-
264
-
265
-
266
-
267
-
268
-
269
-
270
-
271
-
272
-
273
-
274
-
275
-
276
-
277
-
278
-
279
-
280
-
281
-
282
-
283
-
284
-
285
-
286
-
287
-
288
-
289
-
290
-
291
-
292
-
293
-
294
-
295
-
296
-
297
-
298
-
299
-
300
-
301
-
302
-
303
-
304
-
305
-
306
-
307
-
308
-
309
-
310
-
311
-
312
-
313
-
314
-
315
-
316
-
317
-
318
-
319
-
320
-
321
-
322
-
323
-
324
-
325
-
326
-
327
-
328
-
329
-
330
-
331
-
332
-
333
-
334
-
335
-
336
-
337
-
338
-
339
-
340
-
341
-
342
-
343
-
344
-
345
-
346
-
347
-
348
-
349
-
350
-
351
-
352
-
353
-
354
-
355
-
356
 |
 |

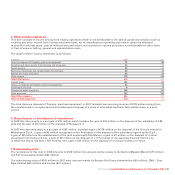
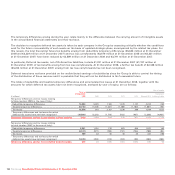
12. Other information by nature
The income statement includes personnel costs for €7,466 million in 2008 (€6,959 million in 2007).
An analysis of the average number of employees by category is provided as follows:
2008 2007
Managers 2,442 2,365
White-collar 57,693 53,888
Blue-collar 138,005 123,348
Average number of employees 198,140 179,601
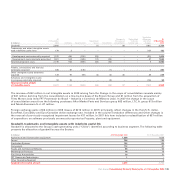
13. Earnings per share
As explained at the Note 24 below, Fiat S.p.A. share capital is represented by three different classes of shares (ordinary shares,
preference shares and saving shares) that participate in dividends with different rights. Profit or loss of the period attributable to
each class of share is determined in accordance with the share’s contractual dividend rights, and for this purpose the net profit or
loss attributable to ordinary equity holders of the parent entity is adjusted by the amount of the preference dividends attributable
to saving shares declared in the period equal to €0.31 per share (€0.155 per share in 2007). In order to determine earnings per
share, the amount obtained has been divided by the weighted average number of outstanding shares.
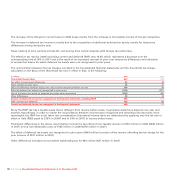
Payment of the proposed dividend is contingent upon approval by shareholders at the Annual General Meeting and has therefore
not been recognised as a liability in the Group Consolidated financial statements.
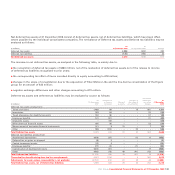
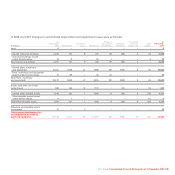
The following table shows the reconciliation between the net profit or loss attributable to equity holders of the parent and the
profit attributable to each class of shares, as well as, the weighted average number of outstanding shares for the two years
presented:
2008 2007
Ordinary Preference Saving Ordinary Preference Saving
shares shares shares Total shares shares shares Total
Profit attributable to equity
holders of the parent € millions 1,612 1,953
Preferred dividends declared
for the period € millions ––2525 – – 12 12
Profit available for distribution
to all classes of shares € millions 1,363 133 91 1,587 1,659 159 123 1,941
Profit attributable to each class
of shares € millions 1,363 133 116 1,612 1,659 159 135 1,953
Weighted average number
of shares outstanding thousand 1,056,675 103,292 79,913 1,239,880 1,079,175 103,292 79,913 1,262,380
Basic Earnings per share €1.290 1.290 1.445 1.537 1.537 1.692
Fiat Group Consolidated Financial Statements at 31 December 2008 135