Chrysler 2008 Annual Report Download - page 45
Download and view the complete annual report
Please find page 45 of the 2008 Chrysler annual report below. You can navigate through the pages in the report by either clicking on the pages listed below, or by using the keyword search tool below to find specific information within the annual report.-
 1
1 -
2
-
3
-
4
-
5
-
6
-
7
-
8
-
9
-
10
-
11
-
12
-
13
-
14
-
15
-
16
-
17
-
18
-
19
-
20
-
21
-
22
-
23
-
24
-
25
-
26
-
27
-
28
-
29
-
30
-
31
-
32
-
33
-
34
-
 35
35 -
 36
36 -
 37
37 -
 38
38 -
 39
39 -
 40
40 -
 41
41 -
 42
42 -
 43
43 -
 44
44 -
 45
45 -
 46
46 -
 47
47 -
 48
48 -
 49
49 -
 50
50 -
 51
51 -
 52
52 -
 53
53 -
 54
54 -
 55
55 -
56
-
57
-
58
-
59
-
60
-
61
-
62
-
63
-
64
-
65
-
66
-
67
-
68
-
69
-
70
-
71
-
72
-
73
-
74
-
75
-
76
-
77
-
78
-
79
-
80
-
81
-
82
-
83
-
84
-
85
-
86
-
87
-
88
-
89
-
90
-
91
-
92
-
93
-
94
-
95
-
96
-
97
-
98
-
99
-
100
-
101
-
102
-
103
-
104
-
105
-
106
-
107
-
108
-
109
-
110
-
111
-
112
-
113
-
114
-
115
-
116
-
117
-
118
-
119
-
120
-
121
-
122
-
123
-
124
-
125
-
126
-
127
-
128
-
129
-
130
-
131
-
132
-
133
-
134
-
135
-
136
-
137
-
138
-
139
-
140
-
141
-
142
-
143
-
144
-
145
-
146
-
147
-
148
-
149
-
150
-
151
-
152
-
153
-
154
-
155
-
156
-
157
-
158
-
159
-
160
-
161
-
162
-
163
-
164
-
165
-
166
-
167
-
168
-
169
-
170
-
171
-
172
-
173
-
174
-
175
-
176
-
177
-
178
-
179
-
180
-
181
-
182
-
183
-
184
-
185
-
186
-
187
-
188
-
189
-
190
-
191
-
192
-
193
-
194
-
195
-
196
-
197
-
198
-
199
-
200
-
201
-
202
-
203
-
204
-
205
-
206
-
207
-
208
-
209
-
210
-
211
-
212
-
213
-
214
-
215
-
216
-
217
-
218
-
219
-
220
-
221
-
222
-
223
-
224
-
225
-
226
-
227
-
228
-
229
-
230
-
231
-
232
-
233
-
234
-
235
-
236
-
237
-
238
-
239
-
240
-
241
-
242
-
243
-
244
-
245
-
246
-
247
-
248
-
249
-
250
-
251
-
252
-
253
-
254
-
255
-
256
-
257
-
258
-
259
-
260
-
261
-
262
-
263
-
264
-
265
-
266
-
267
-
268
-
269
-
270
-
271
-
272
-
273
-
274
-
275
-
276
-
277
-
278
-
279
-
280
-
281
-
282
-
283
-
284
-
285
-
286
-
287
-
288
-
289
-
290
-
291
-
292
-
293
-
294
-
295
-
296
-
297
-
298
-
299
-
300
-
301
-
302
-
303
-
304
-
305
-
306
-
307
-
308
-
309
-
310
-
311
-
312
-
313
-
314
-
315
-
316
-
317
-
318
-
319
-
320
-
321
-
322
-
323
-
324
-
325
-
326
-
327
-
328
-
329
-
330
-
331
-
332
-
333
-
334
-
335
-
336
-
337
-
338
-
339
-
340
-
341
-
342
-
343
-
344
-
345
-
346
-
347
-
348
-
349
-
350
-
351
-
352
-
353
-
354
-
355
-
356
 |
 |
Report on Operations Financial Review – Fiat Group44
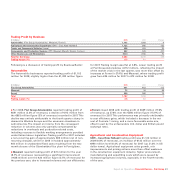
Net Profit
Net financial expense for 2008 totalled €947 million (€564
million for 2007) and included a negative €263 million effect
from the marking-to-market of two stock option related equity
swaps (a €70 million gain was recognised on the swaps for
2007, resulting in a year-over-year net difference of €333
million). The 2007 figure also included a €43 million charge for
early repayment of a CNH bond (original maturity in 2011). The
financial component of costs for pension plans and other
employee benefits totalled €155 million, in line with 2007.
Investment income for 2008 totalled €162 million, down from
the €185 million figure for 2007, mainly due to start-up costs
for joint venture companies.
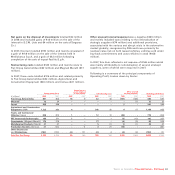
Profit before taxes totalled €2,187 million for 2008, compared
with €2,773 million for 2007. The €586 million decrease was
attributable to lower operating profit (-€180 million), higher net
financial expense (+€383 million) and lower investment income
(-€23 million).
Income taxes totalled €466 million (€719 million for 2007), of
which €168 million for IRAP (€188 million for 2007) and €23
million for taxes relating to prior periods (€21 million for 2007).
The reduction in income tax over the previous year was
attributable to an increase in deferred tax assets, primarily for
timing differences arising during the year, partially offset by an
increase in current taxes connected with higher taxable income
for Group companies outside Italy.
Excluding IRAP, the effective tax rate for 2008 was 16.6% (19%
for 2007).
Net profit (before minority interests) was €1,721 million for
2008, compared to €2,054 million for 2007. On a like-for-like
basis, and therefore excluding the impact of unusual expenses
and the mark-to-market of the equity swaps, net profit for 2008
would be €2,374 million, a 15% improvement on 2007.
Net profit attributable to equity holders of the Parent Company
was €1,612 million for 2008 (€1,953 million for 2007).