Chrysler 2008 Annual Report Download - page 319
Download and view the complete annual report
Please find page 319 of the 2008 Chrysler annual report below. You can navigate through the pages in the report by either clicking on the pages listed below, or by using the keyword search tool below to find specific information within the annual report.-
 1
1 -
2
-
3
-
4
-
5
-
6
-
7
-
8
-
9
-
10
-
11
-
12
-
13
-
14
-
15
-
16
-
17
-
18
-
19
-
20
-
21
-
22
-
23
-
24
-
25
-
26
-
27
-
28
-
29
-
30
-
31
-
32
-
33
-
34
-
35
-
36
-
37
-
38
-
39
-
40
-
41
-
42
-
43
-
44
-
45
-
46
-
47
-
48
-
49
-
50
-
51
-
52
-
53
-
54
-
55
-
56
-
57
-
58
-
59
-
60
-
61
-
62
-
63
-
64
-
65
-
66
-
67
-
68
-
69
-
70
-
71
-
72
-
73
-
74
-
75
-
76
-
77
-
78
-
79
-
80
-
81
-
82
-
83
-
84
-
85
-
86
-
87
-
88
-
89
-
90
-
91
-
92
-
93
-
94
-
95
-
96
-
97
-
98
-
99
-
100
-
101
-
102
-
103
-
104
-
105
-
106
-
107
-
108
-
109
-
110
-
111
-
112
-
113
-
114
-
115
-
116
-
117
-
118
-
119
-
120
-
121
-
122
-
123
-
124
-
125
-
126
-
127
-
128
-
129
-
130
-
131
-
132
-
133
-
134
-
135
-
136
-
137
-
138
-
139
-
140
-
141
-
142
-
143
-
144
-
145
-
146
-
147
-
148
-
149
-
150
-
151
-
152
-
153
-
154
-
155
-
156
-
157
-
158
-
159
-
160
-
161
-
162
-
163
-
164
-
165
-
166
-
167
-
168
-
169
-
170
-
171
-
172
-
173
-
174
-
175
-
176
-
177
-
178
-
179
-
180
-
181
-
182
-
183
-
184
-
185
-
186
-
187
-
188
-
189
-
190
-
191
-
192
-
193
-
194
-
195
-
196
-
197
-
198
-
199
-
200
-
201
-
202
-
203
-
204
-
205
-
206
-
207
-
208
-
209
-
210
-
211
-
212
-
213
-
214
-
215
-
216
-
217
-
218
-
219
-
220
-
221
-
222
-
223
-
224
-
225
-
226
-
227
-
228
-
229
-
230
-
231
-
232
-
233
-
234
-
235
-
236
-
237
-
238
-
239
-
240
-
241
-
242
-
243
-
244
-
245
-
246
-
247
-
248
-
249
-
250
-
251
-
252
-
253
-
254
-
255
-
256
-
257
-
258
-
259
-
260
-
261
-
262
-
263
-
264
-
265
-
266
-
267
-
268
-
269
-
270
-
271
-
272
-
273
-
274
-
275
-
276
-
277
-
278
-
279
-
280
-
281
-
282
-
283
-
284
-
285
-
286
-
287
-
288
-
289
-
290
-
291
-
292
-
293
-
294
-
295
-
296
-
297
-
298
-
299
-
300
-
301
-
302
-
303
-
304
-
305
-
306
-
307
-
308
-
 309
309 -
 310
310 -
 311
311 -
 312
312 -
 313
313 -
 314
314 -
 315
315 -
 316
316 -
 317
317 -
 318
318 -
 319
319 -
 320
320 -
 321
321 -
 322
322 -
 323
323 -
 324
324 -
 325
325 -
 326
326 -
 327
327 -
 328
328 -
 329
329 -
330
-
331
-
332
-
333
-
334
-
335
-
336
-
337
-
338
-
339
-
340
-
341
-
342
-
343
-
344
-
345
-
346
-
347
-
348
-
349
-
350
-
351
-
352
-
353
-
354
-
355
-
356
 |
 |

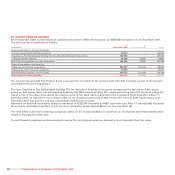
(continued)
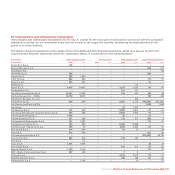
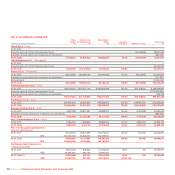
Counterparty Other operating income Personnel Costs Other operating costs Financial income/(expense)
(€ thousands) 2008 2007 2008 2007 2008 2007 2008 2007
Fiat Group International S.A. –2––1,004 11 6 ––
Sirio S.c.p.A. 60 65 ––843 1,205 ––
Teksid S.p.A. 389 993 ––––(7) (6)
Fiat Finance North America Inc. ––––––326 184
Fiat Group Automobiles Belgium S.A. –––––146 ––
Other Group companies 237 87 ––192 11 7 296 242
Total Group companies 48,119 71,471 – – 33,422 36,844 (410,531) (139,917)
Other related parties ––13,281 23,730 24,233 53,988 ––
Total Group companies and other related parties 48,119 71,471 13,281 23,730 57,655 90,832 (410,531) (139,917)
Total line item 70,049 120,322 37,697 55,983 114,433 163,103 (421,675) (149,004)
Percentage of line item 69% 59% 35% 42% 50% 56% 97% 94%
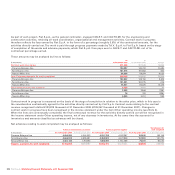
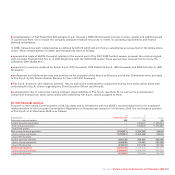
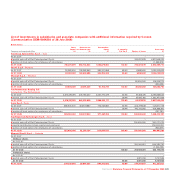
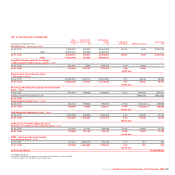
In addition to the impact of intercompany and related party transactions on the income statement, as detailed in the previous table,
a gain of €879,483 thousand was also recognised in 2008 under “Gains/(losses) from non-recurring transactions” following sale of
the “FIAT” brands to the subsidiary company Fiat Group Marketing & Corporate Communication S.p.A., as described in Note 7.
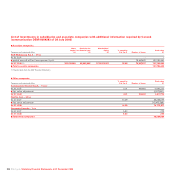
At 31 December 2008
Counterparty
Other fin. Trade Other current Employee Non-curr Trade Current fin.
(€ thousands) assets. recs. recs. provisions fin. pays. pays. pays. Other pays.
Fiat Group Automobiles S.p.A. – 25 – – – 48 – 368
Fiat Automoveis S.A. - FIASA – 954 – – – – – –
Fiat Finance S.p.A. – – – – 1,800,000 – 128,802 –
Fiat Group Marketing & C.C. S.p.A. – 52,800 – – – 767 – –
Fiat Group International S.A. – – – – – 149 – –
Fiat Partecipazioni S.p.A. – – 27,000 – – – – –
Fiat-Revisione Interna S.c.r.l. – – 1,630 – – – – –
Fiat Servizi per l'Industria S.c.p.A. – – 312 – – – – –
Fiat Services S.p.A. – – – – – 310 – –
Fiat Netherlands Holding N.V. – – – – – – 110,174 –
CNH Global N.V. – – 5,941 – – – – –
Iveco S.p.A. – 11 6,856 – – – – –
Leasys S.p.A. – – – – – 148 – –
Orione S.c.p.A. – – – – – 312 – –
Sirio S.c.p.A. – – 300 – – – – –
Other Group companies – 193 – – – 332 – –
IRES tax consolidation – – 285,048 – – – – 316,607
VAT consolidation – – – – – – – 229,084
Financial guarantee contracts 10,531 – – – 10,531 – – –
Total Group companies 10,531 53,983 327,087 – 1,810,531 2,066 238,976 546,059
Fiat S.p.A. Statutory Financial Statements at 31 December 2008318