Chrysler 2008 Annual Report Download - page 46
Download and view the complete annual report
Please find page 46 of the 2008 Chrysler annual report below. You can navigate through the pages in the report by either clicking on the pages listed below, or by using the keyword search tool below to find specific information within the annual report.-
 1
1 -
2
-
3
-
4
-
5
-
6
-
7
-
8
-
9
-
10
-
11
-
12
-
13
-
14
-
15
-
16
-
17
-
18
-
19
-
20
-
21
-
22
-
23
-
24
-
25
-
26
-
27
-
28
-
29
-
30
-
31
-
32
-
33
-
34
-
35
-
 36
36 -
 37
37 -
 38
38 -
 39
39 -
 40
40 -
 41
41 -
 42
42 -
 43
43 -
 44
44 -
 45
45 -
 46
46 -
 47
47 -
 48
48 -
 49
49 -
 50
50 -
 51
51 -
 52
52 -
 53
53 -
 54
54 -
 55
55 -
 56
56 -
57
-
58
-
59
-
60
-
61
-
62
-
63
-
64
-
65
-
66
-
67
-
68
-
69
-
70
-
71
-
72
-
73
-
74
-
75
-
76
-
77
-
78
-
79
-
80
-
81
-
82
-
83
-
84
-
85
-
86
-
87
-
88
-
89
-
90
-
91
-
92
-
93
-
94
-
95
-
96
-
97
-
98
-
99
-
100
-
101
-
102
-
103
-
104
-
105
-
106
-
107
-
108
-
109
-
110
-
111
-
112
-
113
-
114
-
115
-
116
-
117
-
118
-
119
-
120
-
121
-
122
-
123
-
124
-
125
-
126
-
127
-
128
-
129
-
130
-
131
-
132
-
133
-
134
-
135
-
136
-
137
-
138
-
139
-
140
-
141
-
142
-
143
-
144
-
145
-
146
-
147
-
148
-
149
-
150
-
151
-
152
-
153
-
154
-
155
-
156
-
157
-
158
-
159
-
160
-
161
-
162
-
163
-
164
-
165
-
166
-
167
-
168
-
169
-
170
-
171
-
172
-
173
-
174
-
175
-
176
-
177
-
178
-
179
-
180
-
181
-
182
-
183
-
184
-
185
-
186
-
187
-
188
-
189
-
190
-
191
-
192
-
193
-
194
-
195
-
196
-
197
-
198
-
199
-
200
-
201
-
202
-
203
-
204
-
205
-
206
-
207
-
208
-
209
-
210
-
211
-
212
-
213
-
214
-
215
-
216
-
217
-
218
-
219
-
220
-
221
-
222
-
223
-
224
-
225
-
226
-
227
-
228
-
229
-
230
-
231
-
232
-
233
-
234
-
235
-
236
-
237
-
238
-
239
-
240
-
241
-
242
-
243
-
244
-
245
-
246
-
247
-
248
-
249
-
250
-
251
-
252
-
253
-
254
-
255
-
256
-
257
-
258
-
259
-
260
-
261
-
262
-
263
-
264
-
265
-
266
-
267
-
268
-
269
-
270
-
271
-
272
-
273
-
274
-
275
-
276
-
277
-
278
-
279
-
280
-
281
-
282
-
283
-
284
-
285
-
286
-
287
-
288
-
289
-
290
-
291
-
292
-
293
-
294
-
295
-
296
-
297
-
298
-
299
-
300
-
301
-
302
-
303
-
304
-
305
-
306
-
307
-
308
-
309
-
310
-
311
-
312
-
313
-
314
-
315
-
316
-
317
-
318
-
319
-
320
-
321
-
322
-
323
-
324
-
325
-
326
-
327
-
328
-
329
-
330
-
331
-
332
-
333
-
334
-
335
-
336
-
337
-
338
-
339
-
340
-
341
-
342
-
343
-
344
-
345
-
346
-
347
-
348
-
349
-
350
-
351
-
352
-
353
-
354
-
355
-
356
 |
 |

Report on Operations Financial Review – Fiat Group 45
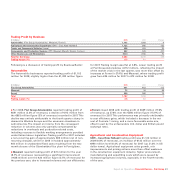
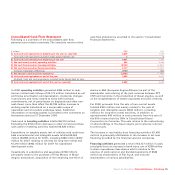
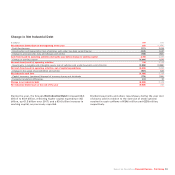
Consolidated Cash Flow Statement
Following is a summary of the consolidated cash flow
statement and related comments. The complete version of the
cash flow statement is provided in the section ‘Consolidated
Financial Statements’.
(€ millions) 2008 2007
A) Cash and cash equivalents at beginning of the year (as reported) 6,639 7,736
Cash and cash equivalents included under Assets held for sale 25
B) Cash and cash equivalents at beginning of the year 6,641 7, 74 1
C) Net cash from/(used in) operating activities 384 5,909
D) Net cash from/(used in) investing activities (6,310) (4,601)
E) Net cash from/(used in) financing activities 3,127 (2,375)
Currency translation differences (159) (33)
F) Net change in cash and cash equivalents (2,958) (1,100)
G) Cash and cash equivalents at end of the year 3,683 6,641
of which: Cash and cash equivalents included under Assets held for sale –2
H) Cash and cash equivalents at end of the year (as reported) 3,683 6,639
In 2008, operating activities generated €384 million in cash.
Income related cash inflows of €4,170 million (calculated as net
profit plus amortisation and depreciation, dividends, changes
in provisions and items related to sales with buy-back
commitments, net of gains/losses on disposals and other non-
cash items) more than offset the €3,786 million increase in
working capital (calculated on a comparable scope of
operations and at constant exchange rates). Additional
information on working capital is provided in the comments on
the balance sheet at 31 December 2008.
Cash used in investing activities totalled €6,310 million.
Excluding the €118 million decrease in other current securities,
cash used in investing activities totalled €6,428 million.
Expenditure on tangible assets (net of vehicles sold under buy-
back commitments) and intangible assets totalled €5,263
million (€3,985 million for 2007), including €284 million (€302
million for 2007) relating to vehicles for long-term rental and
€1,216 million (€932 million for 2007) for capitalised
development costs.
Investments in subsidiaries and associates (€148 million)
principally relate to the purchase of Tritec Motors in Brazil
(engine production), acquisition of the remaining one-third of
shares in EEA (European Engine Alliance) as part of the
shareholder restructuring of the joint ventures between FPT,
CNH and Cummins in the production of diesel engines, as well
as the recapitalisation of certain associates and joint ventures.
For 2008, proceeds from the sale of non-current assets
totalled €300 million and mainly related to the sale of
tangible and intangible assets (€240 million), including
vehicles for long-term rental activities, in addition to
approximately €40 million in cash proceeds from the sale of
the 50% interest held by CNH in Consolidated Diesel
Corporation to Cummins. This sale relates to the restructuring
of shareholdings in the diesel engine joint ventures referred
to previously.
The increase in receivables from financing activities (€1,493
million) is principally attributable to the increase in net new
financing provided by the financial services companies.
Financing activities generated a total of €3,127 million in cash,
principally from an increase in bank loans, net of €238 million
in share repurchases (less shares sold in relation to the
exercise of stock options) and dividend payments of €546
million (to shareholders of Fiat S.p.A. and minority
shareholders of various subsidiaries).