Chrysler 2008 Annual Report Download - page 207
Download and view the complete annual report
Please find page 207 of the 2008 Chrysler annual report below. You can navigate through the pages in the report by either clicking on the pages listed below, or by using the keyword search tool below to find specific information within the annual report.-
 1
1 -
2
-
3
-
4
-
5
-
6
-
7
-
8
-
9
-
10
-
11
-
12
-
13
-
14
-
15
-
16
-
17
-
18
-
19
-
20
-
21
-
22
-
23
-
24
-
25
-
26
-
27
-
28
-
29
-
30
-
31
-
32
-
33
-
34
-
35
-
36
-
37
-
38
-
39
-
40
-
41
-
42
-
43
-
44
-
45
-
46
-
47
-
48
-
49
-
50
-
51
-
52
-
53
-
54
-
55
-
56
-
57
-
58
-
59
-
60
-
61
-
62
-
63
-
64
-
65
-
66
-
67
-
68
-
69
-
70
-
71
-
72
-
73
-
74
-
75
-
76
-
77
-
78
-
79
-
80
-
81
-
82
-
83
-
84
-
85
-
86
-
87
-
88
-
89
-
90
-
91
-
92
-
93
-
94
-
95
-
96
-
97
-
98
-
99
-
100
-
101
-
102
-
103
-
104
-
105
-
106
-
107
-
108
-
109
-
110
-
111
-
112
-
113
-
114
-
115
-
116
-
117
-
118
-
119
-
120
-
121
-
122
-
123
-
124
-
125
-
126
-
127
-
128
-
129
-
130
-
131
-
132
-
133
-
134
-
135
-
136
-
137
-
138
-
139
-
140
-
141
-
142
-
143
-
144
-
145
-
146
-
147
-
148
-
149
-
150
-
151
-
152
-
153
-
154
-
155
-
156
-
157
-
158
-
159
-
160
-
161
-
162
-
163
-
164
-
165
-
166
-
167
-
168
-
169
-
170
-
171
-
172
-
173
-
174
-
175
-
176
-
177
-
178
-
179
-
180
-
181
-
182
-
183
-
184
-
185
-
186
-
187
-
188
-
189
-
190
-
191
-
192
-
193
-
194
-
195
-
196
-
 197
197 -
 198
198 -
 199
199 -
 200
200 -
 201
201 -
 202
202 -
 203
203 -
 204
204 -
 205
205 -
 206
206 -
 207
207 -
 208
208 -
 209
209 -
 210
210 -
 211
211 -
 212
212 -
 213
213 -
 214
214 -
 215
215 -
 216
216 -
 217
217 -
218
-
219
-
220
-
221
-
222
-
223
-
224
-
225
-
226
-
227
-
228
-
229
-
230
-
231
-
232
-
233
-
234
-
235
-
236
-
237
-
238
-
239
-
240
-
241
-
242
-
243
-
244
-
245
-
246
-
247
-
248
-
249
-
250
-
251
-
252
-
253
-
254
-
255
-
256
-
257
-
258
-
259
-
260
-
261
-
262
-
263
-
264
-
265
-
266
-
267
-
268
-
269
-
270
-
271
-
272
-
273
-
274
-
275
-
276
-
277
-
278
-
279
-
280
-
281
-
282
-
283
-
284
-
285
-
286
-
287
-
288
-
289
-
290
-
291
-
292
-
293
-
294
-
295
-
296
-
297
-
298
-
299
-
300
-
301
-
302
-
303
-
304
-
305
-
306
-
307
-
308
-
309
-
310
-
311
-
312
-
313
-
314
-
315
-
316
-
317
-
318
-
319
-
320
-
321
-
322
-
323
-
324
-
325
-
326
-
327
-
328
-
329
-
330
-
331
-
332
-
333
-
334
-
335
-
336
-
337
-
338
-
339
-
340
-
341
-
342
-
343
-
344
-
345
-
346
-
347
-
348
-
349
-
350
-
351
-
352
-
353
-
354
-
355
-
356
 |
 |

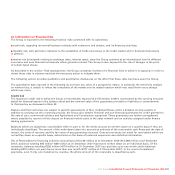
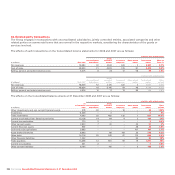
34. Related party transactions
The Group engages in transactions with unconsolidated subsidiaries, jointly controlled entities, associated companies and other
related parties on commercial terms that are normal in the respective markets, considering the characteristics of the goods or
services involved.
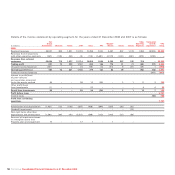
The effects of such transactions on the Consolidated income statements for 2008 and 2007 are as follows:
of which: with related parties
Jointly
Unconsolidated controlled Associated Other related Total related Effect on
(€ millions) Total 2008 Subsidiaries entities companies parties parties Total (%)
Net revenues 59,380 32 2,524 443 2 3,001 5.1%
Cost of sales 49,423 21 4,403 125 61 4,610 9.3%
Selling, general and administrative costs 5,075 8 23 12 56 99 2.0%
of which: with related parties
Jointly
Unconsolidated controlled Associated Other related Total related Effect
(€ millions) Total 2007 Subsidiaries entities companies parties parties on Total
Net revenues 58,529 52 2,125 372 2 2,551 4.4%
Cost of sales 48,924 16 3,145 54 49 3,264 6.7%
Selling, general and administrative costs 4,924 10 17 13 99 139 2.8%
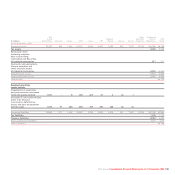
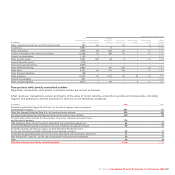
The effects on the Consolidated balance sheets at 31 December 2008 and 2007 are as follows:
of which: with related parties
At Jointly
31 December Unconsolidated controlled Associated Other related Total related Effect
(€ millions) 2008 Subsidiaries entities companies parties parties on Total
Other investments and non current financial assets 278 32 – 16 – 48 17.3%
Inventories 11,346 – 2 – – 20%
Trade receivables 4,390 32 462 132 1 627 14.3%
Current receivables from financing activities 13,136 14 114 4 2 134 1.0%
Current tax receivables 770 2 – – – 20.3%
Other current assets 2,600 7 20 – 24 51 2%
Current financial assets 967 – – – 46 46 4.8%
Cash and cash equivalents 3,683 – – – 101 101 2.7%
Asset-backed financing 6,663 – 116 143 20 279 4.2%
Other debt 14,716 35 242 47 170 494 3.4%
Other financial liabilities 1,202 - – – 95 95 7.9%
Trade payables 13,258 12 961 59 19 1,051 7.9%
Current tax payables 331 2 – – – 20.6%
Other current liabilities 6,185 – 150 – 3 153 2.5%
Fiat Group Consolidated Financial Statements at 31 December 2008206