Chrysler 2008 Annual Report Download - page 142
Download and view the complete annual report
Please find page 142 of the 2008 Chrysler annual report below. You can navigate through the pages in the report by either clicking on the pages listed below, or by using the keyword search tool below to find specific information within the annual report.-
 1
1 -
2
-
3
-
4
-
5
-
6
-
7
-
8
-
9
-
10
-
11
-
12
-
13
-
14
-
15
-
16
-
17
-
18
-
19
-
20
-
21
-
22
-
23
-
24
-
25
-
26
-
27
-
28
-
29
-
30
-
31
-
32
-
33
-
34
-
35
-
36
-
37
-
38
-
39
-
40
-
41
-
42
-
43
-
44
-
45
-
46
-
47
-
48
-
49
-
50
-
51
-
52
-
53
-
54
-
55
-
56
-
57
-
58
-
59
-
60
-
61
-
62
-
63
-
64
-
65
-
66
-
67
-
68
-
69
-
70
-
71
-
72
-
73
-
74
-
75
-
76
-
77
-
78
-
79
-
80
-
81
-
82
-
83
-
84
-
85
-
86
-
87
-
88
-
89
-
90
-
91
-
92
-
93
-
94
-
95
-
96
-
97
-
98
-
99
-
100
-
101
-
102
-
103
-
104
-
105
-
106
-
107
-
108
-
109
-
110
-
111
-
112
-
113
-
114
-
115
-
116
-
117
-
118
-
119
-
120
-
121
-
122
-
123
-
124
-
125
-
126
-
127
-
128
-
129
-
130
-
131
-
 132
132 -
 133
133 -
 134
134 -
 135
135 -
 136
136 -
 137
137 -
 138
138 -
 139
139 -
 140
140 -
 141
141 -
 142
142 -
 143
143 -
 144
144 -
 145
145 -
 146
146 -
 147
147 -
 148
148 -
 149
149 -
 150
150 -
 151
151 -
 152
152 -
153
-
154
-
155
-
156
-
157
-
158
-
159
-
160
-
161
-
162
-
163
-
164
-
165
-
166
-
167
-
168
-
169
-
170
-
171
-
172
-
173
-
174
-
175
-
176
-
177
-
178
-
179
-
180
-
181
-
182
-
183
-
184
-
185
-
186
-
187
-
188
-
189
-
190
-
191
-
192
-
193
-
194
-
195
-
196
-
197
-
198
-
199
-
200
-
201
-
202
-
203
-
204
-
205
-
206
-
207
-
208
-
209
-
210
-
211
-
212
-
213
-
214
-
215
-
216
-
217
-
218
-
219
-
220
-
221
-
222
-
223
-
224
-
225
-
226
-
227
-
228
-
229
-
230
-
231
-
232
-
233
-
234
-
235
-
236
-
237
-
238
-
239
-
240
-
241
-
242
-
243
-
244
-
245
-
246
-
247
-
248
-
249
-
250
-
251
-
252
-
253
-
254
-
255
-
256
-
257
-
258
-
259
-
260
-
261
-
262
-
263
-
264
-
265
-
266
-
267
-
268
-
269
-
270
-
271
-
272
-
273
-
274
-
275
-
276
-
277
-
278
-
279
-
280
-
281
-
282
-
283
-
284
-
285
-
286
-
287
-
288
-
289
-
290
-
291
-
292
-
293
-
294
-
295
-
296
-
297
-
298
-
299
-
300
-
301
-
302
-
303
-
304
-
305
-
306
-
307
-
308
-
309
-
310
-
311
-
312
-
313
-
314
-
315
-
316
-
317
-
318
-
319
-
320
-
321
-
322
-
323
-
324
-
325
-
326
-
327
-
328
-
329
-
330
-
331
-
332
-
333
-
334
-
335
-
336
-
337
-
338
-
339
-
340
-
341
-
342
-
343
-
344
-
345
-
346
-
347
-
348
-
349
-
350
-
351
-
352
-
353
-
354
-
355
-
356
 |
 |
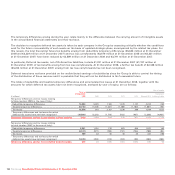
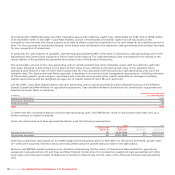
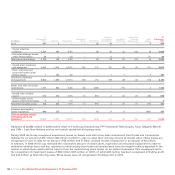
As previously mentioned, the largest allocations of goodwill are in the agricultural equipment segment where, even in the current
crisis, earnings expectations are positive. The construction equipment segment has been the most significantly impacted by the
current worldwide financial and credit crisis which has had dramatic effects on many industries and has caused significant
worldwide declines in industry unit sales of light construction equipment, where CNH has a stronger market position, as well as
heavy construction equipment. These declines in the construction equipment industry are expected to continue into 2009. However,
the recoverable amount of each cash-generating unit, calculated using the two methods mentioned above, exceeded the related
carrying value, and therefore goodwill was not impaired as of December 31, 2008 in the Agricultural and Construction equipment
Sector.
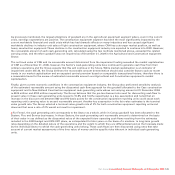
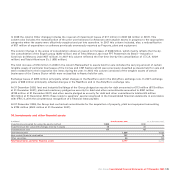
The net book value of CNH and its recoverable amount determined from the impairment testing exceeded the market capitalisation
of CNH as of December 31, 2008, however, the Sector’s cash-generating units have continued to generate cash flow from their
ordinary operations and the Group expects that this will continue in the future. While market capitalisation is an indicator of
impairment under IAS 36, the Group believes the recoverable amount determination should also consider factors such as recent
trends in our market capitalisation and an expected control premium based on comparable transactional history, therefore there is
a reasonable basis for the excess of estimated recoverable amount over Agricultural and Construction equipment’s market
capitalisation.
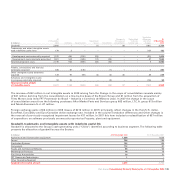
Finally, given current economic conditions in the construction equipment industry, the Group also performed sensitivity analysis
of the estimated recoverable amount using the discounted cash flow approach for the goodwill allocated to the Case construction
equipment and to New Holland Construction equipment cash-generating units whose net carrying amount at 31 December 2008
is €205 million and €192 million respectively. The Group believes that the pre-tax discount rate used for discounting cash flow to
present value in these cash generating units (equal to 15.8% and 14.3% respectively) is a key assumption and noted that an
increase in the discount rate between 880 and 910 basis points for the construction equipment reporting units could cause each
reporting unit’s carrying value to exceed recoverable amount. Another key assumption in the fair value estimates is the terminal
value growth rate. The Group selected a terminal value growth rate of 2% for both construction equipment reporting units and
observed that even a rate of 0% would not result in impairment.
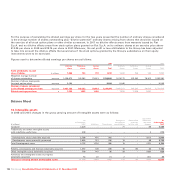
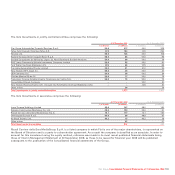
For Ferrari, the cash generating unit corresponds to the Sector as a whole, while in Comau goodwill has been allocated to the
System, Pico and Service businesses. In those Sectors, the cash-generating unit recoverable amount is determined on the basis
of their value in use defined as the discounted value of the expected future operating cash flows resulting from the estimates
included in the 2009 budget and 2010-2011 plans, as extrapolated for later years on the basis of a medium- to long-term growth
rates depending on the detailed nature of the operations and the extent to which they are differentiated and on the forecasts made
by the individual Sector to which the cash-generating units belong. These cash flows are then discounted using rates that take
account of current market assessments of the time value of money and the specific risks inherent in individual cash-generating
units.
Fiat Group Consolidated Financial Statements at 31 December 2008 141