Chrysler 2008 Annual Report Download - page 53
Download and view the complete annual report
Please find page 53 of the 2008 Chrysler annual report below. You can navigate through the pages in the report by either clicking on the pages listed below, or by using the keyword search tool below to find specific information within the annual report.-
 1
1 -
2
-
3
-
4
-
5
-
6
-
7
-
8
-
9
-
10
-
11
-
12
-
13
-
14
-
15
-
16
-
17
-
18
-
19
-
20
-
21
-
22
-
23
-
24
-
25
-
26
-
27
-
28
-
29
-
30
-
31
-
32
-
33
-
34
-
35
-
36
-
37
-
38
-
39
-
40
-
41
-
42
-
 43
43 -
 44
44 -
 45
45 -
 46
46 -
 47
47 -
 48
48 -
 49
49 -
 50
50 -
 51
51 -
 52
52 -
 53
53 -
 54
54 -
 55
55 -
 56
56 -
 57
57 -
 58
58 -
 59
59 -
 60
60 -
 61
61 -
 62
62 -
 63
63 -
64
-
65
-
66
-
67
-
68
-
69
-
70
-
71
-
72
-
73
-
74
-
75
-
76
-
77
-
78
-
79
-
80
-
81
-
82
-
83
-
84
-
85
-
86
-
87
-
88
-
89
-
90
-
91
-
92
-
93
-
94
-
95
-
96
-
97
-
98
-
99
-
100
-
101
-
102
-
103
-
104
-
105
-
106
-
107
-
108
-
109
-
110
-
111
-
112
-
113
-
114
-
115
-
116
-
117
-
118
-
119
-
120
-
121
-
122
-
123
-
124
-
125
-
126
-
127
-
128
-
129
-
130
-
131
-
132
-
133
-
134
-
135
-
136
-
137
-
138
-
139
-
140
-
141
-
142
-
143
-
144
-
145
-
146
-
147
-
148
-
149
-
150
-
151
-
152
-
153
-
154
-
155
-
156
-
157
-
158
-
159
-
160
-
161
-
162
-
163
-
164
-
165
-
166
-
167
-
168
-
169
-
170
-
171
-
172
-
173
-
174
-
175
-
176
-
177
-
178
-
179
-
180
-
181
-
182
-
183
-
184
-
185
-
186
-
187
-
188
-
189
-
190
-
191
-
192
-
193
-
194
-
195
-
196
-
197
-
198
-
199
-
200
-
201
-
202
-
203
-
204
-
205
-
206
-
207
-
208
-
209
-
210
-
211
-
212
-
213
-
214
-
215
-
216
-
217
-
218
-
219
-
220
-
221
-
222
-
223
-
224
-
225
-
226
-
227
-
228
-
229
-
230
-
231
-
232
-
233
-
234
-
235
-
236
-
237
-
238
-
239
-
240
-
241
-
242
-
243
-
244
-
245
-
246
-
247
-
248
-
249
-
250
-
251
-
252
-
253
-
254
-
255
-
256
-
257
-
258
-
259
-
260
-
261
-
262
-
263
-
264
-
265
-
266
-
267
-
268
-
269
-
270
-
271
-
272
-
273
-
274
-
275
-
276
-
277
-
278
-
279
-
280
-
281
-
282
-
283
-
284
-
285
-
286
-
287
-
288
-
289
-
290
-
291
-
292
-
293
-
294
-
295
-
296
-
297
-
298
-
299
-
300
-
301
-
302
-
303
-
304
-
305
-
306
-
307
-
308
-
309
-
310
-
311
-
312
-
313
-
314
-
315
-
316
-
317
-
318
-
319
-
320
-
321
-
322
-
323
-
324
-
325
-
326
-
327
-
328
-
329
-
330
-
331
-
332
-
333
-
334
-
335
-
336
-
337
-
338
-
339
-
340
-
341
-
342
-
343
-
344
-
345
-
346
-
347
-
348
-
349
-
350
-
351
-
352
-
353
-
354
-
355
-
356
 |
 |

Report on Operations Financial Review – Fiat Group52
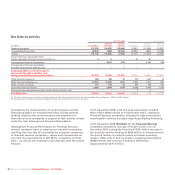
Considering the characteristics of central treasury activity,
financial payables for Industrial Activities include partially
funding raised by the central treasury and transferred to
financial services companies in support of their activity (shown
under the item Intersegment Financial Receivables).
Intersegment Financial Receivables for Financial Services,
instead, represent loans or advances to industrial companies,
resulting from the sale of receivables by industrial companies
to financial services companies – where such transactions do
not meet the requirements of IAS 39 for recognition of those
sales – as well as any temporary cash deposits with the central
treasury.
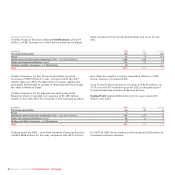
At 31 December 2008, Cash and cash equivalents included
€473 million (€530 million at 31 December 2007), relating to
Financial Services companies, allocated to debt servicing for
securitisation vehicles included under Asset-Backed Financing.
At 31 December 2008, Net Debt for the Financial Services
companies showed an increase of €1,227 million over 31
December 2007, principally from the €1,503 million increase in
the portfolio and the funding of €283 million in investments for
the period (mainly in vehicles leased out under operating
leases), offset only in part by positive operating performance
(€268 million) and currency translation differences
(approximately €270 million).
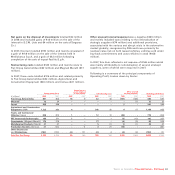
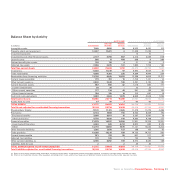
Net Debt by Activity
At 31.12.2008 At 31.12.2007
Industrial Financial Industrial Financial
(€ millions) Consolidated Activities Services Consolidated Activities Services
Financial payables (21,379) (14,522) (13,590) (17,951) (10,706) (12,351)
- Asset-backed financing (6,663) (669) (6,014) (6,820) (683) (6,149)
- Other (14,716) (13,853) (7,576) (11,131) (10,023) (6,202)
Current financial receivables from
jointly controlled financial services entities (a) 33–81 81 –
Intersegment financial receivables – 6,162 570 – 4,762 344
Intersegment financial receivables
included under Assets held for sale ––1–––
Financial payables net of intersegment
and current financial receivables from
jointly controlled financial services entities (21,376) (8,357) (13,019) (17,870) (5,863) (12,007)
Other financial assets (b) 764 748 19 703 687 16
Other financial liabilities (b) (1,202) (1,078) (127) (188) (153) (35)
Other current securities 177 134 43 291 136 155
Cash and cash equivalents 3,683 2,604 1,079 6,639 5,546 1,093
Cash and cash equivalents included under Assets held for sale –––22–
Net (Debt)/Cash (17,954) (5,949) (12,005) (10,423) 355 (10,778)
(a) This item includes current financial receivables payable to Fiat Group companies by Fiat Group Automobiles Financial Services - FAFS (now FGA Capital).
(b) Includes assets and liabilities related to recognition of derivative financial instruments at fair value.