Chrysler 2008 Annual Report Download - page 300
Download and view the complete annual report
Please find page 300 of the 2008 Chrysler annual report below. You can navigate through the pages in the report by either clicking on the pages listed below, or by using the keyword search tool below to find specific information within the annual report.-
 1
1 -
2
-
3
-
4
-
5
-
6
-
7
-
8
-
9
-
10
-
11
-
12
-
13
-
14
-
15
-
16
-
17
-
18
-
19
-
20
-
21
-
22
-
23
-
24
-
25
-
26
-
27
-
28
-
29
-
30
-
31
-
32
-
33
-
34
-
35
-
36
-
37
-
38
-
39
-
40
-
41
-
42
-
43
-
44
-
45
-
46
-
47
-
48
-
49
-
50
-
51
-
52
-
53
-
54
-
55
-
56
-
57
-
58
-
59
-
60
-
61
-
62
-
63
-
64
-
65
-
66
-
67
-
68
-
69
-
70
-
71
-
72
-
73
-
74
-
75
-
76
-
77
-
78
-
79
-
80
-
81
-
82
-
83
-
84
-
85
-
86
-
87
-
88
-
89
-
90
-
91
-
92
-
93
-
94
-
95
-
96
-
97
-
98
-
99
-
100
-
101
-
102
-
103
-
104
-
105
-
106
-
107
-
108
-
109
-
110
-
111
-
112
-
113
-
114
-
115
-
116
-
117
-
118
-
119
-
120
-
121
-
122
-
123
-
124
-
125
-
126
-
127
-
128
-
129
-
130
-
131
-
132
-
133
-
134
-
135
-
136
-
137
-
138
-
139
-
140
-
141
-
142
-
143
-
144
-
145
-
146
-
147
-
148
-
149
-
150
-
151
-
152
-
153
-
154
-
155
-
156
-
157
-
158
-
159
-
160
-
161
-
162
-
163
-
164
-
165
-
166
-
167
-
168
-
169
-
170
-
171
-
172
-
173
-
174
-
175
-
176
-
177
-
178
-
179
-
180
-
181
-
182
-
183
-
184
-
185
-
186
-
187
-
188
-
189
-
190
-
191
-
192
-
193
-
194
-
195
-
196
-
197
-
198
-
199
-
200
-
201
-
202
-
203
-
204
-
205
-
206
-
207
-
208
-
209
-
210
-
211
-
212
-
213
-
214
-
215
-
216
-
217
-
218
-
219
-
220
-
221
-
222
-
223
-
224
-
225
-
226
-
227
-
228
-
229
-
230
-
231
-
232
-
233
-
234
-
235
-
236
-
237
-
238
-
239
-
240
-
241
-
242
-
243
-
244
-
245
-
246
-
247
-
248
-
249
-
250
-
251
-
252
-
253
-
254
-
255
-
256
-
257
-
258
-
259
-
260
-
261
-
262
-
263
-
264
-
265
-
266
-
267
-
268
-
269
-
270
-
271
-
272
-
273
-
274
-
275
-
276
-
277
-
278
-
279
-
280
-
281
-
282
-
283
-
284
-
285
-
286
-
287
-
288
-
289
-
 290
290 -
 291
291 -
 292
292 -
 293
293 -
 294
294 -
 295
295 -
 296
296 -
 297
297 -
 298
298 -
 299
299 -
 300
300 -
 301
301 -
 302
302 -
 303
303 -
 304
304 -
 305
305 -
 306
306 -
 307
307 -
 308
308 -
 309
309 -
 310
310 -
311
-
312
-
313
-
314
-
315
-
316
-
317
-
318
-
319
-
320
-
321
-
322
-
323
-
324
-
325
-
326
-
327
-
328
-
329
-
330
-
331
-
332
-
333
-
334
-
335
-
336
-
337
-
338
-
339
-
340
-
341
-
342
-
343
-
344
-
345
-
346
-
347
-
348
-
349
-
350
-
351
-
352
-
353
-
354
-
355
-
356
 |
 |

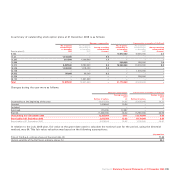
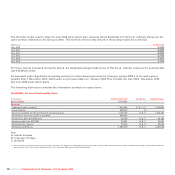
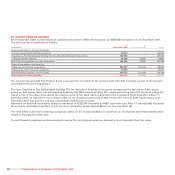
A summary of outstanding stock option plans at 31 December 2008 is as follows:
Managers compensation Compensation as member of the Board
No. of options No. of options No. of options No. of options
outstanding at outstanding at Average remaining outstanding at outstanding at Average remaining
31 December 31 December contractual life 31 December 31 December contractual life
Exercise price (€) 2008 2007 (in years) 2008 2007 (in years)
6.583 ––– 10,670,000 10,670,000 2.0
10.24 1,414,000 –5.8 – ––
10.397 921,500 1,008,500 1.7 – ––
12.699 ––– 500,000 500,000 1.0
13.370 9,497,500 9,792,500 5.8 10,000,000 10,000,000 5.8
16.526 1,044,000 1,119,000 0.8 – ––
23.708 ––––1,000,000 –
24.853 50,000 50,000 0.2 – ––
25.459 ––––250,000 –
28.122 –1,051,500 ––––
Total 12,927,000 13,021,500 –21,170,000 22,420,000 –
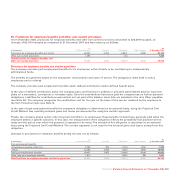
Changes during the year were as follows:
Managers compensation Compensation as member of the Board
Average exercise Average exercise
price price
Number of options (€) Number of options (€)
Outstanding at the beginning of the year 13,021,500 14.65 22,420,000 10.72
Granted 1,418,500 10.24 – –
Forfeited ––––
Exercised (71,000) 10.397 – –
Expired (1,442,000) 24.22 (1,250,000) 24.06
Outstanding at 31 December 2008 12,927,000 13.11 21,170,000 9.93
Exercisable at 31 December 2008 2,015,500 13.93 11,170,000 6.86
Exercisable at 31 December 2007 3,229,000 18.52 1,750,000 20.81
In relation to the July 2008 plan, fair value at the grant date used to calculate the notional cost for the period, using the binomial
method, was €4. This fair value valuation was based on the following assumptions:
July 2008 Plan
Price of Fiat S.p.A. ordinary shares at the grant date (€) 11.4 3
Historic volatility of the Fiat S.p.A. ordinary shares (%) 44.2
Fiat S.p.A. Statutory Financial Statements at 31 December 2008 299