Cablevision 2014 Annual Report Download - page 62
Download and view the complete annual report
Please find page 62 of the 2014 Cablevision annual report below. You can navigate through the pages in the report by either clicking on the pages listed below, or by using the keyword search tool below to find specific information within the annual report.-
 1
1 -
2
-
3
-
4
-
5
-
6
-
7
-
8
-
9
-
10
-
11
-
12
-
13
-
14
-
15
-
16
-
17
-
18
-
19
-
20
-
21
-
22
-
23
-
24
-
25
-
26
-
27
-
28
-
29
-
30
-
31
-
32
-
33
-
34
-
35
-
36
-
37
-
38
-
39
-
40
-
41
-
42
-
43
-
44
-
45
-
46
-
47
-
48
-
49
-
50
-
51
-
 52
52 -
 53
53 -
 54
54 -
 55
55 -
 56
56 -
 57
57 -
 58
58 -
 59
59 -
 60
60 -
 61
61 -
 62
62 -
 63
63 -
 64
64 -
 65
65 -
 66
66 -
 67
67 -
 68
68 -
 69
69 -
 70
70 -
 71
71 -
 72
72 -
73
-
74
-
75
-
76
-
77
-
78
-
79
-
80
-
81
-
82
-
83
-
84
-
85
-
86
-
87
-
88
-
89
-
90
-
91
-
92
-
93
-
94
-
95
-
96
-
97
-
98
-
99
-
100
-
101
-
102
-
103
-
104
-
105
-
106
-
107
-
108
-
109
-
110
-
111
-
112
-
113
-
114
-
115
-
116
-
117
-
118
-
119
-
120
-
121
-
122
-
123
-
124
-
125
-
126
-
127
-
128
-
129
-
130
-
131
-
132
-
133
-
134
-
135
-
136
-
137
-
138
-
139
-
140
-
141
-
142
-
143
-
144
-
145
-
146
-
147
-
148
-
149
-
150
-
151
-
152
-
153
-
154
-
155
-
156
-
157
-
158
-
159
-
160
-
161
-
162
-
163
-
164
 |
 |

56
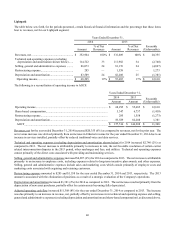
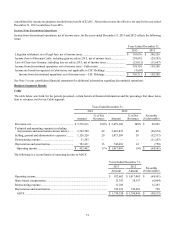
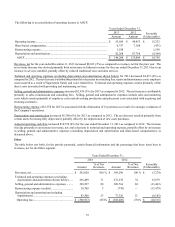
The following is a reconciliation of operating loss to AOCF deficit:
Years Ended December 31,
2013 2012 Favorable
(Unfavorable)
Amount Amount
Operating loss ......................................................................................................... $(308,923) $ (288,408)$(20,515)
Share-based compensation...................................................................................... 13,605 15,160 (1,555)
Restructuring expense (credits)............................................................................... 10,709 (770)11,479
Depreciation and amortization (including impairments) ........................................ 83,508 77,326 6,182
AOCF deficit ........................................................................................................ $(201,101) $ (196,692)$(4,409)
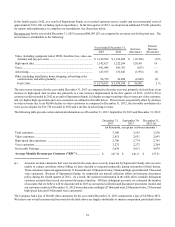
Revenues, net for the year ended December 31, 2013 decreased $7,270 (2%) as compared to revenues, net for the prior year. The
net decrease is attributable to the following:
Decrease in revenues at Newsday (from $283,917 to $265,504) due primarily to decreases in advertising
revenues as a result of the continued challenging economic environment and competition from other media....... $(18,413)
Increase in advertising revenues at News 12 Networks and commission revenues at Cablevision Media Sales........ 9,535
Net decrease in other revenues .................................................................................................................................... (438)
Intra-segment eliminations........................................................................................................................................... 2,046
$ (7,270)
As filed with the Alliance for Audited Media ("AAM") on January 15, 2014 and subject to audit by the AAM, Newsday submitted
its most recent report which indicated total average circulation for the three months ended December 29, 2013 of approximately
437,000 on weekdays, approximately 434,000 on Saturdays and approximately 495,000 on Sundays. These circulation figures
include digital editions (most of which are free to Optimum Online and certain Newsday print subscribers) to Newsday's restricted
access website and mobile applications. These circulation figures include Newsday's total average print circulation of approximately
255,000 on weekdays, approximately 251,000 on Saturdays and approximately 313,000 on Sundays, which represents a decline
of approximately 6.4%, 5.3%, and 5.6%, respectively, over the comparable prior year period. Circulation revenue for the year
ended December 31, 2013 decreased $2,175 (3%) primarily due to a decline in home delivery and single copy volume, partially
offset by the impact of rate increases.
On October 15, 2013, Newsday's other publications, which include amNew York and Star Community Publishing and are distributed
for free, filed their most recent Publishers statements with the Certified Audit of Circulations, a subsidiary of the Alliance for
Audited Media. amNew York averaged gross weekday circulation of approximately 337,000 for the six months ended September 29,
2013, an increase of approximately 2.4% over the comparable prior year period while Star Community Publishing distributed
approximately 1,803,000 copies each week (for the six months ended September 29, 2013), representing a decrease of approximately
2.2% over the comparable prior year period.
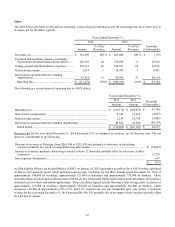
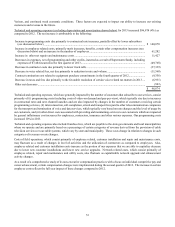
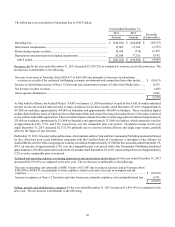
Technical and operating expenses (excluding depreciation and amortization shown below) for the year ended December 31, 2013
decreased $15,879 (6%) as compared to the prior year. The net decrease is attributable to the following:
Decrease in operating costs primarily at MSG Varsity of $13,693 due to reduced activities and at Newsday (from
$188,999 to $180,035, due primarily to lower employee related costs and a decrease in newsprint and ink
expenses)...................................................................................................................................................................... $(22,670)
Increase in expenses at News 12 Networks and other businesses, primarily employee costs and professional fees.. 6,791
$ (15,879)
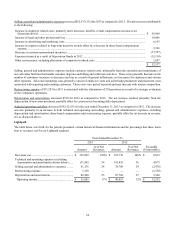
Selling, general, and administrative expenses for the year ended December 31, 2013 increased $11,463 (4%) as compared to the
prior year. The net increase is attributable to the following: