Cablevision 2014 Annual Report Download - page 123
Download and view the complete annual report
Please find page 123 of the 2014 Cablevision annual report below. You can navigate through the pages in the report by either clicking on the pages listed below, or by using the keyword search tool below to find specific information within the annual report.-
 1
1 -
2
-
3
-
4
-
5
-
6
-
7
-
8
-
9
-
10
-
11
-
12
-
13
-
14
-
15
-
16
-
17
-
18
-
19
-
20
-
21
-
22
-
23
-
24
-
25
-
26
-
27
-
28
-
29
-
30
-
31
-
32
-
33
-
34
-
35
-
36
-
37
-
38
-
39
-
40
-
41
-
42
-
43
-
44
-
45
-
46
-
47
-
48
-
49
-
50
-
51
-
52
-
53
-
54
-
55
-
56
-
57
-
58
-
59
-
60
-
61
-
62
-
63
-
64
-
65
-
66
-
67
-
68
-
69
-
70
-
71
-
72
-
73
-
74
-
75
-
76
-
77
-
78
-
79
-
80
-
81
-
82
-
83
-
84
-
85
-
86
-
87
-
88
-
89
-
90
-
91
-
92
-
93
-
94
-
95
-
96
-
97
-
98
-
99
-
100
-
101
-
102
-
103
-
104
-
105
-
106
-
107
-
108
-
109
-
110
-
111
-
112
-
 113
113 -
 114
114 -
 115
115 -
 116
116 -
 117
117 -
 118
118 -
 119
119 -
 120
120 -
 121
121 -
 122
122 -
 123
123 -
 124
124 -
 125
125 -
 126
126 -
 127
127 -
 128
128 -
 129
129 -
 130
130 -
 131
131 -
 132
132 -
 133
133 -
134
-
135
-
136
-
137
-
138
-
139
-
140
-
141
-
142
-
143
-
144
-
145
-
146
-
147
-
148
-
149
-
150
-
151
-
152
-
153
-
154
-
155
-
156
-
157
-
158
-
159
-
160
-
161
-
162
-
163
-
164
 |
 |

COMBINED NOTES TO CONSOLIDATED FINANCIAL STATEMENTS (continued)
(Dollars in thousands, except share and per share amounts)
F-34
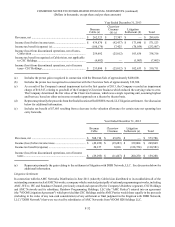
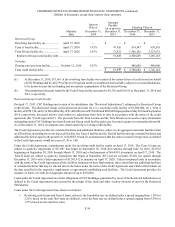
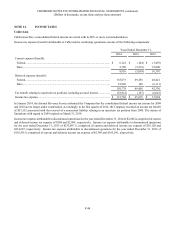
Depreciation expense on property, plant and equipment (including capital leases) for the years ended December 31, 2014, 2013
and 2012 amounted to $852,451, $858,899 and $879,242 (including impairment charges of $425, $10,997 and $829 in 2014, 2013
and 2012), respectively.
At December 31, 2014 and 2013, the gross amount of equipment and related accumulated amortization recorded under capital
leases were as follows:
December 31,
2014 2013
Equipment........................................................................................................................................... $ 95,719 $ 65,454
Less accumulated amortization........................................................................................................... (39,951)(31,138)
$ 55,768 $ 34,316
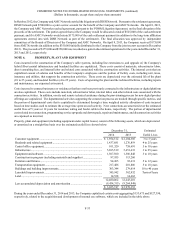
NOTE 7. OPERATING LEASES
The Company leases certain office, production, and transmission facilities under terms of leases expiring at various dates through
2034. The leases generally provide for escalating rentals over the term of the lease plus certain real estate taxes and other costs
or credits. Costs associated with such operating leases are recognized on a straight-line basis over the initial lease term. The
difference between rent expense and rent paid is recorded as deferred rent. In addition, the Company rents space on utility poles
for its operations. The Company's pole rental agreements are for varying terms, and management anticipates renewals as they
expire. Rent expense, including pole rentals, for the years ended December 31, 2014, 2013 and 2012 amounted to $77,769, $75,553
and $78,472, respectively.
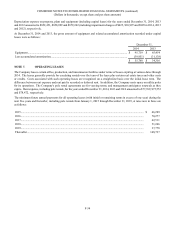
The minimum future annual payments for all operating leases (with initial or remaining terms in excess of one year) during the
next five years and thereafter, including pole rentals from January 1, 2015 through December 31, 2019, at rates now in force are
as follows:
2015............................................................................................................................................................................ $ 66,289
2016............................................................................................................................................................................ 70,277
2017............................................................................................................................................................................ 62,511
2018............................................................................................................................................................................ 51,246
2019............................................................................................................................................................................ 37,778
Thereafter................................................................................................................................................................... 168,737