Cablevision 2014 Annual Report Download - page 38
Download and view the complete annual report
Please find page 38 of the 2014 Cablevision annual report below. You can navigate through the pages in the report by either clicking on the pages listed below, or by using the keyword search tool below to find specific information within the annual report.-
 1
1 -
2
-
3
-
4
-
5
-
6
-
7
-
8
-
9
-
10
-
11
-
12
-
13
-
14
-
15
-
16
-
17
-
18
-
19
-
20
-
21
-
22
-
23
-
24
-
25
-
26
-
27
-
 28
28 -
 29
29 -
 30
30 -
 31
31 -
 32
32 -
 33
33 -
 34
34 -
 35
35 -
 36
36 -
 37
37 -
 38
38 -
 39
39 -
 40
40 -
 41
41 -
 42
42 -
 43
43 -
 44
44 -
 45
45 -
 46
46 -
 47
47 -
 48
48 -
49
-
50
-
51
-
52
-
53
-
54
-
55
-
56
-
57
-
58
-
59
-
60
-
61
-
62
-
63
-
64
-
65
-
66
-
67
-
68
-
69
-
70
-
71
-
72
-
73
-
74
-
75
-
76
-
77
-
78
-
79
-
80
-
81
-
82
-
83
-
84
-
85
-
86
-
87
-
88
-
89
-
90
-
91
-
92
-
93
-
94
-
95
-
96
-
97
-
98
-
99
-
100
-
101
-
102
-
103
-
104
-
105
-
106
-
107
-
108
-
109
-
110
-
111
-
112
-
113
-
114
-
115
-
116
-
117
-
118
-
119
-
120
-
121
-
122
-
123
-
124
-
125
-
126
-
127
-
128
-
129
-
130
-
131
-
132
-
133
-
134
-
135
-
136
-
137
-
138
-
139
-
140
-
141
-
142
-
143
-
144
-
145
-
146
-
147
-
148
-
149
-
150
-
151
-
152
-
153
-
154
-
155
-
156
-
157
-
158
-
159
-
160
-
161
-
162
-
163
-
164
 |
 |
32
shopping commissions. We also derive revenues from the sale of advertising time available on the programming carried on our
cable television systems.
Revenue increases are derived from rate increases, increases in the number of subscribers to our services, including additional
services sold to our existing subscribers, programming package upgrades by our video customers, speed tier upgrades by our high-
speed data customers, and acquisition transactions that result in the addition of new subscribers.
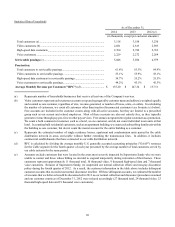
Our ability to increase the number of subscribers to our services is significantly related to our penetration rates (the number of
subscribers to our services as a percentage of serviceable passings, which represent the estimated number of single residence
homes, apartment and condominium units passed by the cable distribution network in areas serviceable without further extending
the transmission lines, including commercial establishments that have connected to our cable distribution network). As penetration
rates increase, the number of available homes to which we can market our services generally decreases. Due to the high penetration
of our video, high-speed data and VoIP services (53.1%, 54.7% and 44.2%, respectively, of serviceable passings at December 31,
2014), our ability to maintain or increase our existing customers and revenue in the future will continue to be negatively impacted.
We face competition from telephone companies, DBS service providers, and others, including the delivery of video content over
the Internet directly to subscribers. As discussed in greater detail under “Competition” above, we face intense competition from
Verizon. Verizon has constructed a fiber to the home network plant that passes a significant number of households in our service
area. Verizon does not publicly report the extent of their build-out or penetration by area. Our estimate of Verizon's build out and
sales activity in our service area is difficult to assess because it is based upon visual inspections and other limited estimating
techniques, and therefore serves only as an approximation. We estimate that Verizon is currently able to sell a fiber-based video
service, as well as high-speed data and VoIP services, to at least half of the households in our service area. In certain other portions
of our service area, Verizon has also built its fiber network where we believe it is not currently able to sell its fiber-based video
service, but is able to sell its high-speed data and VoIP services. In these areas (as well as other parts of our service area) Verizon
markets DBS services along with its high-speed data and VoIP services. Verizon’s fiber network also passes areas where we believe
it is not currently able to sell its video, high-speed data or VoIP services. Accordingly, Verizon may increase the number of
customers in our service area to whom it is able to sell video, high speed data and VoIP services in the future.
Frontier offers video service, as well as high-speed data and VoIP services, in competition with us in most of our Connecticut
service area. Frontier also markets DBS services in this service area. Verizon and Frontier have made and may continue to make
promotional offers at prices lower than ours. Verizon has significantly greater financial resources than we do.
This competition affects our ability to add or retain customers and creates pressure upon the pricing of our services. Competition,
particularly from Verizon, has negatively impacted our revenues and caused subscriber declines in our service areas. To the extent
Verizon and Frontier continue to offer competitive and promotional packages, our ability to maintain or increase our existing
customers and revenue will continue to be negatively impacted.
The two major DBS services, DISH Network and DIRECTV, are available to the vast majority of our customers. These companies
each offer video programming that is substantially similar to the video service that we offer, at competitive prices. Each of these
competitors has significantly greater financial resources than we do.
In addition, our revenues have been negatively impacted by the prolonged weak economic conditions as customers with less
disposable income may have been more willing to obtain services from our competitors or other sources. Our revenues may
continue to be negatively impacted by the prolonged weak economic conditions in certain portions of our service area.
Historically, we have made substantial investments in our network and the development of new and innovative products and other
service offerings for our customers as a way of differentiating ourselves from our competitors and may continue to do so in the
future. For example, we have deployed WiFi access points throughout our footprint.
Our programming costs, which are the most significant component of our Cable segment's operating expenses, have increased and
are expected to continue to increase primarily as a result of contractual rate increases and new channel launches. See "Business
Segments Results - Cable" below for a further discussion of revenues and operating expenses and "Liquidity and Capital Resources
- Capital Expenditures" for additional information regarding our capital expenditures.
Lightpath
Lightpath accounted for 5% of our consolidated revenues, net of inter-segment eliminations, for the year ended December 31,
2014. Lightpath derives revenues from the sale of fiber based telecommunications services to the business market. Lightpath
operates in a highly competitive business telecommunications market and competes against the very largest telecommunications
companies - incumbent local exchange carriers such as Verizon and AT&T, other competitive local exchange companies, and long
distance companies. To the extent our competitors reduce their prices, future success of our Lightpath business may be negatively
impacted.