Cablevision 2014 Annual Report Download - page 50
Download and view the complete annual report
Please find page 50 of the 2014 Cablevision annual report below. You can navigate through the pages in the report by either clicking on the pages listed below, or by using the keyword search tool below to find specific information within the annual report.-
 1
1 -
2
-
3
-
4
-
5
-
6
-
7
-
8
-
9
-
10
-
11
-
12
-
13
-
14
-
15
-
16
-
17
-
18
-
19
-
20
-
21
-
22
-
23
-
24
-
25
-
26
-
27
-
28
-
29
-
30
-
31
-
32
-
33
-
34
-
35
-
36
-
37
-
38
-
39
-
 40
40 -
 41
41 -
 42
42 -
 43
43 -
 44
44 -
 45
45 -
 46
46 -
 47
47 -
 48
48 -
 49
49 -
 50
50 -
 51
51 -
 52
52 -
 53
53 -
 54
54 -
 55
55 -
 56
56 -
 57
57 -
 58
58 -
 59
59 -
 60
60 -
61
-
62
-
63
-
64
-
65
-
66
-
67
-
68
-
69
-
70
-
71
-
72
-
73
-
74
-
75
-
76
-
77
-
78
-
79
-
80
-
81
-
82
-
83
-
84
-
85
-
86
-
87
-
88
-
89
-
90
-
91
-
92
-
93
-
94
-
95
-
96
-
97
-
98
-
99
-
100
-
101
-
102
-
103
-
104
-
105
-
106
-
107
-
108
-
109
-
110
-
111
-
112
-
113
-
114
-
115
-
116
-
117
-
118
-
119
-
120
-
121
-
122
-
123
-
124
-
125
-
126
-
127
-
128
-
129
-
130
-
131
-
132
-
133
-
134
-
135
-
136
-
137
-
138
-
139
-
140
-
141
-
142
-
143
-
144
-
145
-
146
-
147
-
148
-
149
-
150
-
151
-
152
-
153
-
154
-
155
-
156
-
157
-
158
-
159
-
160
-
161
-
162
-
163
-
164
 |
 |

44
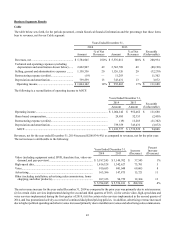
Partially offsetting these increases was a decrease in revenue primarily due to a decline in video customers as compared to December
31, 2013.
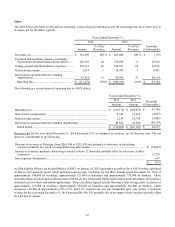
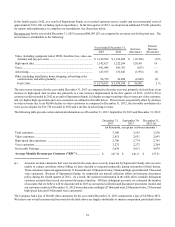
The following table presents certain statistical information as of December 31, 2014, September 30, 2014 and December 31, 2013:
December 31,
2014 September 30,
2014 December 31,
2013
(in thousands, except per customer amounts)
Total customers............................................................................................. 3,118 3,129 3,188
Video customers............................................................................................ 2,681 2,715 2,813
High-speed data customers ........................................................................... 2,760 2,756 2,780
Voice customers............................................................................................ 2,229 2,240 2,272
Serviceable Passings ..................................................................................... 5,046 5,064 5,034
Average Monthly Revenue per Customer ("RPC") (a)........................... $ 155.20 $ 154.50 $ 147.34
(a) RPC is calculated by dividing the average monthly GAAP revenues for the Cable segment for the respective quarter
presented by the average number of total customers served by our cable systems for the respective period.
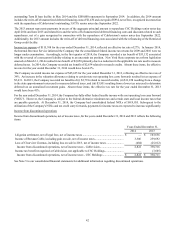
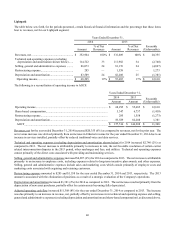
The following table reflects our net customer increases (decreases) for the years ended December 31, 2014 and 2013:
Years Ended December 31,
2014 2013
(in thousands)
Total customers..................................................................................................................... (70.7) (41.9)
Video customers.................................................................................................................... (131.7) (80.0)
High-speed data customers ................................................................................................... (20.2) 16.8
Voice customers.................................................................................................................... (43.1) 8.3
We believe our overall customer declines noted in the table above are largely attributable to intense competition, particularly from
Verizon, the result of disciplined pricing and credit policies primarily in 2014, and prolonged weak economic conditions in certain
portions of our service area. These factors are expected to impact our ability to maintain or increase our existing customers and
revenue in the future.
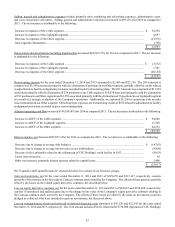
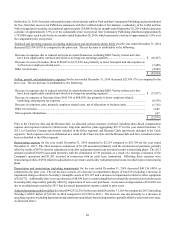
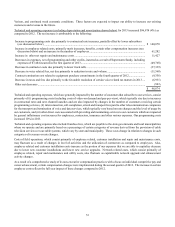
Technical and operating expenses (excluding depreciation and amortization shown below) for 2014 increased $80,198 (3%) as
compared to 2013. The net increase is attributable to the following:
Increase in programming costs due primarily to contractual rate increases and new channel launches, partially
offset by lower customers......................................................................................................................................... $ 91,494
Increase in employee related costs, primarily merit increases and benefits, and an increase in the number of
employees ................................................................................................................................................................. 23,952
Increase in certain taxes and fees due primarily to the favorable resolution of a tax matter in 2013.......................... 3,379
Decrease in contractor costs due primarily to lower truck rolls................................................................................... (28,687)
Decreases in net expenses relating to Superstorm Sandy (includes insurance recovery of $2,997 in 2014)............... (10,481)
Decrease in material and equipment repair costs due to decreased activity ................................................................ (8,197)
Other net increases ....................................................................................................................................................... 8,738
$ 80,198
Technical and operating expenses consist primarily of (i) programming costs (including costs of video-on-demand and pay-per-
view), which typically rise due to increases in contractual rates and new channel launches and are also impacted by changes in the