Cablevision 2014 Annual Report Download - page 32
Download and view the complete annual report
Please find page 32 of the 2014 Cablevision annual report below. You can navigate through the pages in the report by either clicking on the pages listed below, or by using the keyword search tool below to find specific information within the annual report.-
 1
1 -
2
-
3
-
4
-
5
-
6
-
7
-
8
-
9
-
10
-
11
-
12
-
13
-
14
-
15
-
16
-
17
-
18
-
19
-
20
-
21
-
 22
22 -
 23
23 -
 24
24 -
 25
25 -
 26
26 -
 27
27 -
 28
28 -
 29
29 -
 30
30 -
 31
31 -
 32
32 -
 33
33 -
 34
34 -
 35
35 -
 36
36 -
 37
37 -
 38
38 -
 39
39 -
 40
40 -
 41
41 -
 42
42 -
43
-
44
-
45
-
46
-
47
-
48
-
49
-
50
-
51
-
52
-
53
-
54
-
55
-
56
-
57
-
58
-
59
-
60
-
61
-
62
-
63
-
64
-
65
-
66
-
67
-
68
-
69
-
70
-
71
-
72
-
73
-
74
-
75
-
76
-
77
-
78
-
79
-
80
-
81
-
82
-
83
-
84
-
85
-
86
-
87
-
88
-
89
-
90
-
91
-
92
-
93
-
94
-
95
-
96
-
97
-
98
-
99
-
100
-
101
-
102
-
103
-
104
-
105
-
106
-
107
-
108
-
109
-
110
-
111
-
112
-
113
-
114
-
115
-
116
-
117
-
118
-
119
-
120
-
121
-
122
-
123
-
124
-
125
-
126
-
127
-
128
-
129
-
130
-
131
-
132
-
133
-
134
-
135
-
136
-
137
-
138
-
139
-
140
-
141
-
142
-
143
-
144
-
145
-
146
-
147
-
148
-
149
-
150
-
151
-
152
-
153
-
154
-
155
-
156
-
157
-
158
-
159
-
160
-
161
-
162
-
163
-
164
 |
 |

26
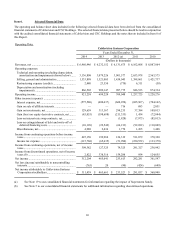
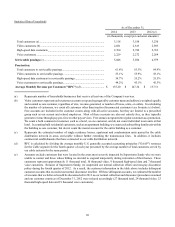
Item 6. Selected Financial Data
The operating and balance sheet data included in the following selected financial data have been derived from the consolidated
financial statements of Cablevision and CSC Holdings. The selected financial data presented below should be read in conjunction
with the audited consolidated financial statements of Cablevision and CSC Holdings and the notes thereto included in Item 8 of
this Report.
Operating Data:
Cablevision Systems Corporation
Years Ended December 31,
2014 2013 2012 (a) 2011 2010
(Dollars in thousands)
Revenues, net ............................................................. $ 6,460,946 $ 6,232,152 $ 6,131,675 $ 6,162,608 $ 6,087,864
Operating expenses:
Technical and operating (excluding depreciation,
amortization and impairments shown below) ...... 3,136,808 3,079,226 3,001,577 2,653,978 2,563,575
Selling, general and administrative.......................... 1,533,898 1,521,005 1,454,045 1,398,061 1,421,737
Restructuring expense (credits)................................ 2,480 23,550 (770) 6,311 (58)
Depreciation and amortization (including
impairments)......................................................... 866,502 909,147 907,775 846,533 874,334
Operating income....................................................... 921,258 699,224 769,048 1,257,725 1,228,276
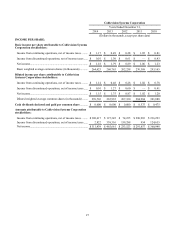
Other income (expense): ............................................
Interest expense, net................................................. (575,580)(600,637)(660,074)(685,967)(704,162)
Gain on sale of affiliate interests ............................. — — 716 683 2,051
Gain on investments, net.......................................... 129,659 313,167 294,235 37,384 109,813
Gain (loss) on equity derivative contracts, net......... (45,055)(198,688)(211,335) 1,454 (72,044)
Loss on interest rate swap contracts, net.................. — — (1,828)(7,973)(85,013)
Loss on extinguishment of debt and write-off of
deferred financing costs ....................................... (10,120)(22,542)(66,213)(92,692)(110,049)
Miscellaneous, net.................................................... 4,988 2,436 1,770 1,265 1,448
Income from continuing operations before income
taxes........................................................................ 425,150 192,960 126,319 511,879 370,320
Income tax expense.................................................. (115,768)(65,635)(51,994)(220,552)(133,378)
Income from continuing operations, net of income
taxes........................................................................ 309,382 127,325 74,325 291,327 236,942
Income from discontinued operations, net of income
taxes (b) .................................................................. 2,822 338,316 159,288 954 124,655
Net income ................................................................. 312,204 465,641 233,613 292,281 361,597
Net loss (income) attributable to noncontrolling
interests................................................................... (765) 20 (90)(424)(649)
Net income attributable to Cablevision Systems
Corporation stockholders........................................ $ 311,439 $ 465,661 $ 233,523 $ 291,857 $ 360,948
(a) See Note 19 to our consolidated financial statements for information regarding the impact of Superstorm Sandy.
(b) See Note 5 to our consolidated financial statements for additional information regarding discontinued operations.