Cablevision 2014 Annual Report Download - page 53
Download and view the complete annual report
Please find page 53 of the 2014 Cablevision annual report below. You can navigate through the pages in the report by either clicking on the pages listed below, or by using the keyword search tool below to find specific information within the annual report.-
 1
1 -
2
-
3
-
4
-
5
-
6
-
7
-
8
-
9
-
10
-
11
-
12
-
13
-
14
-
15
-
16
-
17
-
18
-
19
-
20
-
21
-
22
-
23
-
24
-
25
-
26
-
27
-
28
-
29
-
30
-
31
-
32
-
33
-
34
-
35
-
36
-
37
-
38
-
39
-
40
-
41
-
42
-
 43
43 -
 44
44 -
 45
45 -
 46
46 -
 47
47 -
 48
48 -
 49
49 -
 50
50 -
 51
51 -
 52
52 -
 53
53 -
 54
54 -
 55
55 -
 56
56 -
 57
57 -
 58
58 -
 59
59 -
 60
60 -
 61
61 -
 62
62 -
 63
63 -
64
-
65
-
66
-
67
-
68
-
69
-
70
-
71
-
72
-
73
-
74
-
75
-
76
-
77
-
78
-
79
-
80
-
81
-
82
-
83
-
84
-
85
-
86
-
87
-
88
-
89
-
90
-
91
-
92
-
93
-
94
-
95
-
96
-
97
-
98
-
99
-
100
-
101
-
102
-
103
-
104
-
105
-
106
-
107
-
108
-
109
-
110
-
111
-
112
-
113
-
114
-
115
-
116
-
117
-
118
-
119
-
120
-
121
-
122
-
123
-
124
-
125
-
126
-
127
-
128
-
129
-
130
-
131
-
132
-
133
-
134
-
135
-
136
-
137
-
138
-
139
-
140
-
141
-
142
-
143
-
144
-
145
-
146
-
147
-
148
-
149
-
150
-
151
-
152
-
153
-
154
-
155
-
156
-
157
-
158
-
159
-
160
-
161
-
162
-
163
-
164
 |
 |

47
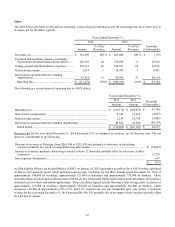
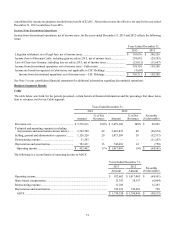
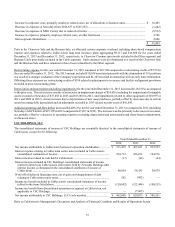
Other
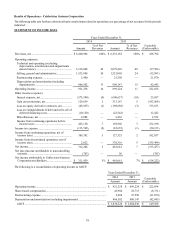
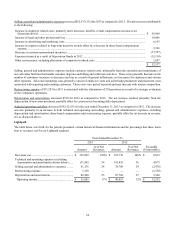
The table below sets forth, for the periods presented, certain financial information and the percentage that those items bear to
revenues, net for the Other segment.
Years Ended December 31,
2014 2013
Amount % of Net
Revenues Amount % of Net
Revenues Favorable
(Unfavorable)
Revenues, net........................................................... $ 361,305 100 % $ 362,020 100 % $ (715)
Technical and operating expenses (excluding
depreciation and amortization shown below) ...... 230,565 64 256,499 71 25,934
Selling, general and administrative expenses.......... 296,351 82 320,227 88 23,876
Restructuring expense ............................................. 2,214 1 10,709 3 8,495
Depreciation and amortization (including
impairments) ........................................................ 43,354 12 83,508 23 40,154
Operating loss ....................................................... $(211,179) (58)% $ (308,923) (85)% $ 97,744
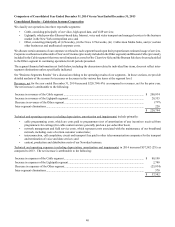
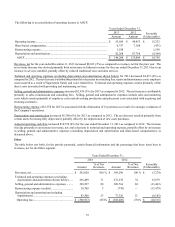
The following is a reconciliation of operating loss to AOCF deficit:
Years Ended December 31,
2014 2013 Favorable
(Unfavorable)
Amount Amount
Operating loss ......................................................................................................... $(211,179) $ (308,923)$ 97,744
Share-based compensation...................................................................................... 8,742 13,605 (4,863)
Restructuring expense............................................................................................. 2,214 10,709 (8,495)
Depreciation and amortization (including impairments) ........................................ 43,354 83,508 (40,154)
AOCF deficit ........................................................................................................ $(156,869) $ (201,101)$ 44,232
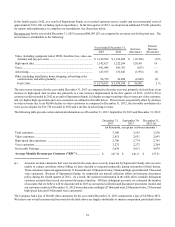
Revenues, net for the year ended December 31, 2014 decreased $715 as compared to revenues, net for the prior year. The net
decrease is attributable to the following:
Decrease in revenues at Newsday (from $265,504 to $251,439) due primarily to decreases in advertising
revenues primarily as a result of competition from other media.............................................................................. $(14,065)
Increase in revenues, primarily advertising revenues at News 12 Networks, partially offset by a decrease at other
businesses ................................................................................................................................................................. 12,703
Intra-segment eliminations........................................................................................................................................... 647
$ (715)
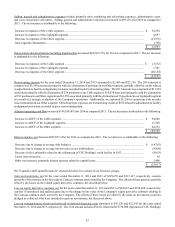
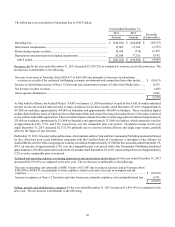
As filed with the Alliance for Audited Media (“AAM”) on January 19, 2015 and subject to audit by the AAM, Newsday submitted
its most recent quarterly report which indicated total average circulation for the three months ended December 28, 2014 of
approximately 340,000 on weekdays, approximately 321,000 on Saturdays and approximately 379,000 on Sundays. These
circulation figures include digital editions (most of which are free to Optimum Online and Newsday print subscribers) to Newsday's
restricted access website and mobile applications. These circulation figures include Newsday's total average print circulation of
approximately 237,000 on weekdays, approximately 228,000 on Saturdays and approximately 284,000 on Sundays, which
represents a decline of approximately 6.9%, 9.2%, and 9.1%, respectively, over the comparable prior year period. Circulation
revenue for the year ended December 31, 2014 increased $4,189 (5%) primarily due to the impact of rate increases partially offset
by a decline in volume.