Cablevision 2014 Annual Report Download - page 145
Download and view the complete annual report
Please find page 145 of the 2014 Cablevision annual report below. You can navigate through the pages in the report by either clicking on the pages listed below, or by using the keyword search tool below to find specific information within the annual report.-
 1
1 -
2
-
3
-
4
-
5
-
6
-
7
-
8
-
9
-
10
-
11
-
12
-
13
-
14
-
15
-
16
-
17
-
18
-
19
-
20
-
21
-
22
-
23
-
24
-
25
-
26
-
27
-
28
-
29
-
30
-
31
-
32
-
33
-
34
-
35
-
36
-
37
-
38
-
39
-
40
-
41
-
42
-
43
-
44
-
45
-
46
-
47
-
48
-
49
-
50
-
51
-
52
-
53
-
54
-
55
-
56
-
57
-
58
-
59
-
60
-
61
-
62
-
63
-
64
-
65
-
66
-
67
-
68
-
69
-
70
-
71
-
72
-
73
-
74
-
75
-
76
-
77
-
78
-
79
-
80
-
81
-
82
-
83
-
84
-
85
-
86
-
87
-
88
-
89
-
90
-
91
-
92
-
93
-
94
-
95
-
96
-
97
-
98
-
99
-
100
-
101
-
102
-
103
-
104
-
105
-
106
-
107
-
108
-
109
-
110
-
111
-
112
-
113
-
114
-
115
-
116
-
117
-
118
-
119
-
120
-
121
-
122
-
123
-
124
-
125
-
126
-
127
-
128
-
129
-
130
-
131
-
132
-
133
-
134
-
 135
135 -
 136
136 -
 137
137 -
 138
138 -
 139
139 -
 140
140 -
 141
141 -
 142
142 -
 143
143 -
 144
144 -
 145
145 -
 146
146 -
 147
147 -
 148
148 -
 149
149 -
 150
150 -
 151
151 -
 152
152 -
 153
153 -
 154
154 -
 155
155 -
156
-
157
-
158
-
159
-
160
-
161
-
162
-
163
-
164
 |
 |

COMBINED NOTES TO CONSOLIDATED FINANCIAL STATEMENTS (continued)
(Dollars in thousands, except share and per share amounts)
F-56
Years Ended December 31,
2014 2013 2012
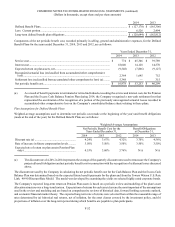
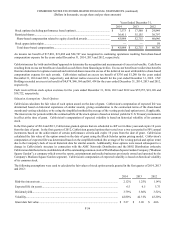
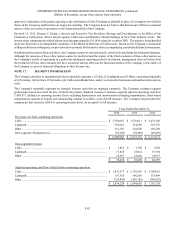
Stock options (including performance based options)................................................ $ 7,573 $ 17,560 $ 29,849
Restricted shares......................................................................................................... 36,411 35,155 30,797
Share-based compensation related to equity classified awards................................ 43,984 52,715 60,646
Stock appreciation rights ............................................................................................ — — 59
Total share-based compensation............................................................................... $ 43,984 $ 52,715 $ 60,705
An income tax benefit of $17,801, $21,682 and $24,747 was recognized in continuing operations resulting from share-based
compensation expense for the years ended December 31, 2014, 2013 and 2012, respectively.
Cablevision uses the 'with-and-without' approach to determine the recognition and measurement of excess tax benefits. Cash flows
resulting from excess tax benefits are classified as cash flows from financing activities. Excess tax benefits are realized tax benefits
from tax deductions for options exercised and restricted shares issued in excess of the deferred tax asset attributable to share-based
compensation expense for such awards. Cablevision realized an excess tax benefit of $336 and $1,280 for the years ended
December 31, 2014 and 2013, respectively, and did not realize excess tax benefit for the year ended December 31, 2012. CSC
Holdings recorded an excess tax benefit of $4,978, $46,164 and $61,434 for the years ended December 31, 2014, 2013 and 2012,
respectively.
Cash received from stock option exercises for the years ended December 31, 2014, 2013 and 2012 was $55,355, $18,120 and
$18,722, respectively.
Valuation Assumptions - Stock Options
Cablevision calculates the fair value of each option award on the date of grant. Cablevision's computation of expected life was
determined based on historical experience of similar awards, giving consideration to the contractual terms of the share-based
awards and vesting schedules, or by using the simplified method (the average of the vesting period and option term), if applicable.
The interest rate for periods within the contractual life of the stock option is based on interest yields for U.S. Treasury instruments
in effect at the time of grant. Cablevision's computation of expected volatility is based on historical volatility of its common
stock.
In the first quarter of 2014 and 2013, Cablevision granted options that are scheduled to cliff vest in three years and expire 10 years
from the date of grant. In the first quarter of 2012, Cablevision granted options that vested over a two year period in 50% annual
increments based on the achievement of certain performance criteria and expire 10 years from the date of grant. Cablevision
calculated the fair value of the option award on the date of grant using the Black-Scholes option pricing model. Cablevision's
computation of expected life was determined based on the simplified method (the average of the vesting period and option term)
due to the Company's lack of recent historical data for similar awards. Additionally, these options were issued subsequent to a
change in Cablevision's structure in connection with the AMC Networks Distribution and the MSG Distribution (whereby
Cablevision distributed to its stockholders all of the outstanding common stock of The Madison Square Garden Company ("Madison
Square Garden"), a company which owns the sports, entertainment and media businesses previously owned and operated by the
Company's Madison Square Garden segment). Cablevision's computation of expected volatility is based on historical volatility
of its common stock.
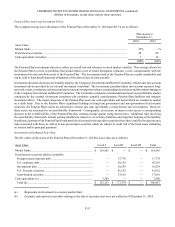
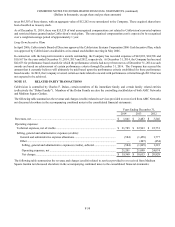
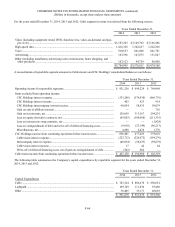
The following assumptions were used to calculate the fair values of stock option awards granted in the first quarter of 2014, 2013
and 2012:
2014 2013 2012
Risk-free interest rate............................................................................................................. 2.12% 1.25% 1.14%
Expected life (in years).......................................................................................................... 6.5 6.5 5.75
Dividend yield........................................................................................................................ 3.79% 3.86% 3.52%
Volatility................................................................................................................................. 42.80% 42.31% 43.20%
Grant date fair value............................................................................................................... $ 5.27 $ 3.96 $ 4.06