Cablevision 2014 Annual Report Download - page 52
Download and view the complete annual report
Please find page 52 of the 2014 Cablevision annual report below. You can navigate through the pages in the report by either clicking on the pages listed below, or by using the keyword search tool below to find specific information within the annual report.-
 1
1 -
2
-
3
-
4
-
5
-
6
-
7
-
8
-
9
-
10
-
11
-
12
-
13
-
14
-
15
-
16
-
17
-
18
-
19
-
20
-
21
-
22
-
23
-
24
-
25
-
26
-
27
-
28
-
29
-
30
-
31
-
32
-
33
-
34
-
35
-
36
-
37
-
38
-
39
-
40
-
41
-
 42
42 -
 43
43 -
 44
44 -
 45
45 -
 46
46 -
 47
47 -
 48
48 -
 49
49 -
 50
50 -
 51
51 -
 52
52 -
 53
53 -
 54
54 -
 55
55 -
 56
56 -
 57
57 -
 58
58 -
 59
59 -
 60
60 -
 61
61 -
 62
62 -
63
-
64
-
65
-
66
-
67
-
68
-
69
-
70
-
71
-
72
-
73
-
74
-
75
-
76
-
77
-
78
-
79
-
80
-
81
-
82
-
83
-
84
-
85
-
86
-
87
-
88
-
89
-
90
-
91
-
92
-
93
-
94
-
95
-
96
-
97
-
98
-
99
-
100
-
101
-
102
-
103
-
104
-
105
-
106
-
107
-
108
-
109
-
110
-
111
-
112
-
113
-
114
-
115
-
116
-
117
-
118
-
119
-
120
-
121
-
122
-
123
-
124
-
125
-
126
-
127
-
128
-
129
-
130
-
131
-
132
-
133
-
134
-
135
-
136
-
137
-
138
-
139
-
140
-
141
-
142
-
143
-
144
-
145
-
146
-
147
-
148
-
149
-
150
-
151
-
152
-
153
-
154
-
155
-
156
-
157
-
158
-
159
-
160
-
161
-
162
-
163
-
164
 |
 |

46
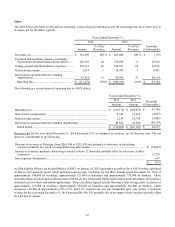
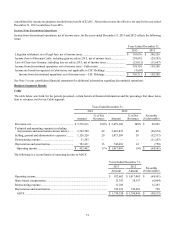
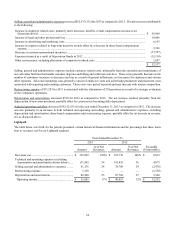
Lightpath
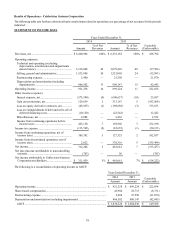
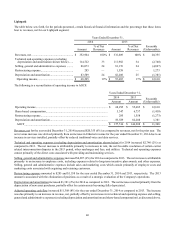
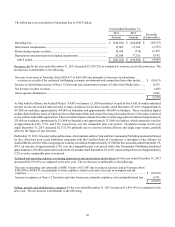
The table below sets forth, for the periods presented, certain historical financial information and the percentage that those items
bear to revenues, net for our Lightpath segment:
Years Ended December 31,
2014 2013
Amount % of Net
Revenues Amount % of Net
Revenues Favorable
(Unfavorable)
Revenues, net .......................................................... $ 352,964 100% $ 332,609 100% $ 20,355
Technical and operating expenses (excluding
depreciation and amortization shown below)...... 114,722 33 111,982 34 (2,740)
Selling, general and administrative expenses ......... 86,073 24 81,176 24 (4,897)
Restructuring expense............................................. 285 — 1,558 — 1,273
Depreciation and amortization................................ 83,589 24 82,208 25 (1,381)
Operating income.................................................. $ 68,295 19% $ 55,685 17% $ 12,610
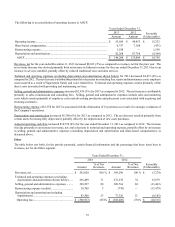
The following is a reconciliation of operating income to AOCF:
Years Ended December 31,
2014 2013 Favorable
(Unfavorable)
Amount Amount
Operating income.................................................................................................... $ 68,295 $ 55,685 $ 12,610
Share-based compensation...................................................................................... 5,347 6,757 (1,410)
Restructuring expense............................................................................................. 285 1,558 (1,273)
Depreciation and amortization................................................................................ 83,589 82,208 1,381
AOCF.................................................................................................................... $ 157,516 $ 146,208 $ 11,308
Revenues, net for the year ended December 31, 2014 increased $20,355 (6%) as compared to revenues, net for the prior year. The
net revenue increase was derived primarily from an increase in Ethernet revenue for the year ended December 31, 2014 due to an
increase in services installed, partially offset by reduced traditional voice and data services.
Technical and operating expenses (excluding depreciation and amortization shown below) for 2014 increased $2,740 (2%) as
compared to 2013. The net increase is attributable primarily to increases in rent, the net favorable resolution of certain carrier
related interconnection disputes in the 2013 period, other surcharges and fees, and utilities. Technical and operating expenses
consist primarily of the direct costs associated with providing and maintaining services.
Selling, general and administrative expenses increased $4,897 (6%) for 2014 as compared to 2013. The net increase is attributable
primarily to an increase in employee costs, including expenses related to long-term incentive plan awards, and other expenses.
Selling, general and administrative expenses include sales and marketing costs which consist primarily of employee costs and
marketing costs associated with acquiring and retaining customers.
Restructuring expense amounted to $285 and $1,558 for the year ended December 31, 2014 and 2013, respectively. The 2013
amount is associated with the elimination of positions as a result of a strategic evaluation of the Company's operations.
Depreciation and amortization increased $1,381 (2%) for 2014 as compared to 2013. The net increase resulted primarily from the
depreciation of new asset purchases, partially offset by certain assets becoming fully depreciated.
Adjusted operating cash flow increased $11,308 (8%) for the year ended December 31, 2014 as compared to 2013. The increase
was due primarily to an increase in revenue, net, partially offset by an increase in in technical and operating expense and selling,
general and administrative expenses (excluding depreciation and amortization and share-based compensation), as discussed above.