Cablevision 2014 Annual Report Download - page 36
Download and view the complete annual report
Please find page 36 of the 2014 Cablevision annual report below. You can navigate through the pages in the report by either clicking on the pages listed below, or by using the keyword search tool below to find specific information within the annual report.-
 1
1 -
2
-
3
-
4
-
5
-
6
-
7
-
8
-
9
-
10
-
11
-
12
-
13
-
14
-
15
-
16
-
17
-
18
-
19
-
20
-
21
-
22
-
23
-
24
-
25
-
 26
26 -
 27
27 -
 28
28 -
 29
29 -
 30
30 -
 31
31 -
 32
32 -
 33
33 -
 34
34 -
 35
35 -
 36
36 -
 37
37 -
 38
38 -
 39
39 -
 40
40 -
 41
41 -
 42
42 -
 43
43 -
 44
44 -
 45
45 -
 46
46 -
47
-
48
-
49
-
50
-
51
-
52
-
53
-
54
-
55
-
56
-
57
-
58
-
59
-
60
-
61
-
62
-
63
-
64
-
65
-
66
-
67
-
68
-
69
-
70
-
71
-
72
-
73
-
74
-
75
-
76
-
77
-
78
-
79
-
80
-
81
-
82
-
83
-
84
-
85
-
86
-
87
-
88
-
89
-
90
-
91
-
92
-
93
-
94
-
95
-
96
-
97
-
98
-
99
-
100
-
101
-
102
-
103
-
104
-
105
-
106
-
107
-
108
-
109
-
110
-
111
-
112
-
113
-
114
-
115
-
116
-
117
-
118
-
119
-
120
-
121
-
122
-
123
-
124
-
125
-
126
-
127
-
128
-
129
-
130
-
131
-
132
-
133
-
134
-
135
-
136
-
137
-
138
-
139
-
140
-
141
-
142
-
143
-
144
-
145
-
146
-
147
-
148
-
149
-
150
-
151
-
152
-
153
-
154
-
155
-
156
-
157
-
158
-
159
-
160
-
161
-
162
-
163
-
164
 |
 |

30
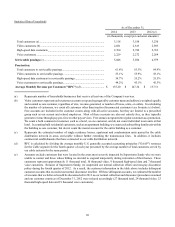
Statistical Data (Unaudited):
As of December 31,
2014 2013 2012 (e)
(in thousands, except per customer amounts)
Total customers (a)........................................................................................... 3,118 3,188 3,230
Video customers (b) ......................................................................................... 2,681 2,813 2,893
High-speed data customers............................................................................... 2,760 2,780 2,763
Voice customers................................................................................................ 2,229 2,272 2,264
Serviceable passings (c).................................................................................... 5,046 5,034 4,979
Penetration:
Total customers to serviceable passings........................................................... 61.8% 63.3% 64.9%
Video customers to serviceable passings ......................................................... 53.1% 55.9% 58.1%
High-speed data customers to serviceable passings......................................... 54.7% 55.2% 55.5%
Voice customers to serviceable passings.......................................................... 44.2% 45.1% 45.5%
Average Monthly Revenue per Customer ("RPC") (d)................................. $ 155.20 $ 147.34 $ 137.51
(a) Represents number of households/businesses that receive at least one of the Company's services.
(b) Video customers represent each customer account (set up and segregated by customer name and address), weighted equally
and counted as one customer, regardless of size, revenue generated, or number of boxes, units, or outlets. In calculating
the number of customers, we count all customers other than inactive/disconnected customers (see footnote (e) below).
Free accounts are included in the customer counts along with all active accounts, but they are limited to a prescribed
group such as our current and retired employees. Most of these accounts are also not entirely free, as they typically
generate revenue through pay-per-view or other pay services. Free status is not granted to regular customers as a promotion.
We count a bulk commercial customer, such as a hotel, as one customer, and do not count individual room units at that
hotel. In counting bulk residential customers, such as an apartment building, we count each subscribing family unit within
the building as one customer, but do not count the master account for the entire building as a customer.
(c) Represents the estimated number of single residence homes, apartment and condominium units passed by the cable
distribution network in areas serviceable without further extending the transmission lines. In addition, it includes
commercial establishments that have connected to our cable distribution network.
(d) RPC is calculated by dividing the average monthly U.S. generally accepted accounting principles ("GAAP") revenues
for the Cable segment for the fourth quarter of each year presented by the average number of total customers served by
our cable systems for the same period.
(e) Amounts exclude customers that were located in the areas most severely impacted by Superstorm Sandy who we were
unable to contact and those whose billing we decided to suspend temporarily during restoration of their homes. These
customers represent approximately 11 thousand total, 10 thousand video, 9 thousand high-speed data and 7 thousand
voice customers. Because of Superstorm Sandy, we suspended our normal collection efforts and non-pay disconnect
policy during the fourth quarter of 2012. As a result, the customer information in the table above includes delinquent
customer accounts that exceeded our normal disconnect timeline. Of these delinquent accounts, we estimated the number
of accounts that we believed would be disconnected in 2013 as our normal collection and disconnect procedures resumed
and our customer counts as of December 31, 2012 were reduced accordingly (27 thousand total, 24 thousand video, 23
thousand high-speed data and 19 thousand voice customers).