Cablevision 2014 Annual Report Download - page 61
Download and view the complete annual report
Please find page 61 of the 2014 Cablevision annual report below. You can navigate through the pages in the report by either clicking on the pages listed below, or by using the keyword search tool below to find specific information within the annual report.-
 1
1 -
2
-
3
-
4
-
5
-
6
-
7
-
8
-
9
-
10
-
11
-
12
-
13
-
14
-
15
-
16
-
17
-
18
-
19
-
20
-
21
-
22
-
23
-
24
-
25
-
26
-
27
-
28
-
29
-
30
-
31
-
32
-
33
-
34
-
35
-
36
-
37
-
38
-
39
-
40
-
41
-
42
-
43
-
44
-
45
-
46
-
47
-
48
-
49
-
50
-
 51
51 -
 52
52 -
 53
53 -
 54
54 -
 55
55 -
 56
56 -
 57
57 -
 58
58 -
 59
59 -
 60
60 -
 61
61 -
 62
62 -
 63
63 -
 64
64 -
 65
65 -
 66
66 -
 67
67 -
 68
68 -
 69
69 -
 70
70 -
 71
71 -
72
-
73
-
74
-
75
-
76
-
77
-
78
-
79
-
80
-
81
-
82
-
83
-
84
-
85
-
86
-
87
-
88
-
89
-
90
-
91
-
92
-
93
-
94
-
95
-
96
-
97
-
98
-
99
-
100
-
101
-
102
-
103
-
104
-
105
-
106
-
107
-
108
-
109
-
110
-
111
-
112
-
113
-
114
-
115
-
116
-
117
-
118
-
119
-
120
-
121
-
122
-
123
-
124
-
125
-
126
-
127
-
128
-
129
-
130
-
131
-
132
-
133
-
134
-
135
-
136
-
137
-
138
-
139
-
140
-
141
-
142
-
143
-
144
-
145
-
146
-
147
-
148
-
149
-
150
-
151
-
152
-
153
-
154
-
155
-
156
-
157
-
158
-
159
-
160
-
161
-
162
-
163
-
164
 |
 |

55
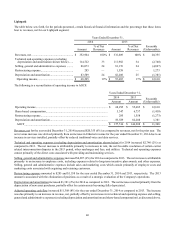
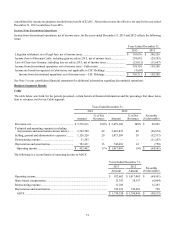
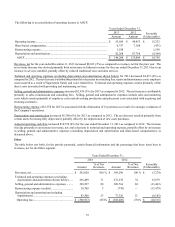
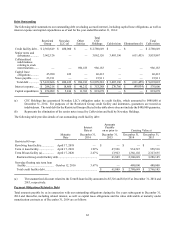
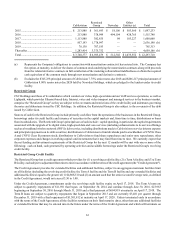
The following is a reconciliation of operating income to AOCF:
Years Ended December 31,
2013 2012 Favorable
(Unfavorable)
Amount Amount
Operating income.................................................................................................... $ 55,685 $ 40,453 $ 15,232
Share-based compensation...................................................................................... 6,757 7,188 (431)
Restructuring expense............................................................................................. 1,558 — 1,558
Depreciation and amortization................................................................................ 82,208 87,768 (5,560)
AOCF.................................................................................................................... $ 146,208 $ 135,409 $ 10,799
Revenues, net for the year ended December 31, 2013 increased $8,833 (3%) as compared to revenues, net for the prior year. The
net revenue increase was derived primarily from an increase in Ethernet revenue for the year ended December 31, 2013 due to an
increase in services installed, partially offset by reduced traditional voice and data services.
Technical and operating expenses (excluding depreciation and amortization shown below) for 2013 decreased $4,873 (4%) as
compared to 2012. The net decrease is attributable primarily to decreases in consulting fees, repair and maintenance costs, employee
costs incurred as a result of Superstorm Sandy and voice related fees. Technical and operating expenses consist primarily of the
direct costs associated with providing and maintaining services.
Selling, general and administrative expenses increased $2,476 (3%) for 2013 as compared to 2012. The net increase is attributable
primarily to sales commissions and consulting fees. Selling, general and administrative expenses include sales and marketing
costs which consist primarily of employee costs and advertising production and placement costs associated with acquiring and
retaining customers.
Restructuring expense of $1,558 for 2013 is associated with the elimination of 16 positions as a result of a strategic evaluation of
the Company's operations.
Depreciation and amortization decreased $5,560 (6%) for 2013 as compared to 2012. The net decrease resulted primarily from
certain assets becoming fully depreciated, partially offset by the depreciation of new asset purchases.
Adjusted operating cash flow increased $10,799 (8%) for the year ended December 31, 2013 as compared to 2012. The increase
was due primarily to an increase in revenue, net, and a decrease in technical and operating expense, partially offset by an increase
in selling, general and administrative expenses (excluding depreciation and amortization and share-based compensation), as
discussed above.
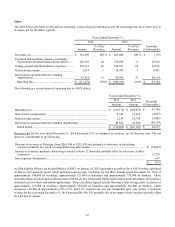
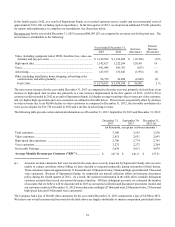
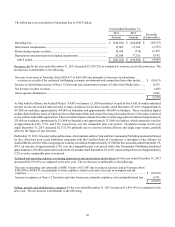
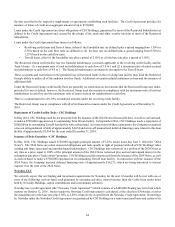
Other
The table below sets forth, for the periods presented, certain financial information and the percentage that those items bear to
revenues, net for the Other segment.
Years Ended December 31,
2013 2012
Amount % of Net
Revenues Amount % of Net
Revenues Favorable
(Unfavorable)
Revenues, net .......................................................... $ 362,020 100 % $ 369,290 100 % $ (7,270)
Technical and operating expenses (excluding
depreciation and amortization shown below)...... 256,499 71 272,378 74 15,879
Selling, general and administrative expenses ......... 320,227 88 308,764 84 (11,463)
Restructuring expense (credits)............................... 10,709 3 (770) — (11,479)
Depreciation and amortization (including
impairments)........................................................ 83,508 23 77,326 21 (6,182)
Operating loss....................................................... $(308,923) (85)% $ (288,408) (78)% $ (20,515)