Cablevision 2014 Annual Report Download - page 56
Download and view the complete annual report
Please find page 56 of the 2014 Cablevision annual report below. You can navigate through the pages in the report by either clicking on the pages listed below, or by using the keyword search tool below to find specific information within the annual report.-
 1
1 -
2
-
3
-
4
-
5
-
6
-
7
-
8
-
9
-
10
-
11
-
12
-
13
-
14
-
15
-
16
-
17
-
18
-
19
-
20
-
21
-
22
-
23
-
24
-
25
-
26
-
27
-
28
-
29
-
30
-
31
-
32
-
33
-
34
-
35
-
36
-
37
-
38
-
39
-
40
-
41
-
42
-
43
-
44
-
45
-
 46
46 -
 47
47 -
 48
48 -
 49
49 -
 50
50 -
 51
51 -
 52
52 -
 53
53 -
 54
54 -
 55
55 -
 56
56 -
 57
57 -
 58
58 -
 59
59 -
 60
60 -
 61
61 -
 62
62 -
 63
63 -
 64
64 -
 65
65 -
 66
66 -
67
-
68
-
69
-
70
-
71
-
72
-
73
-
74
-
75
-
76
-
77
-
78
-
79
-
80
-
81
-
82
-
83
-
84
-
85
-
86
-
87
-
88
-
89
-
90
-
91
-
92
-
93
-
94
-
95
-
96
-
97
-
98
-
99
-
100
-
101
-
102
-
103
-
104
-
105
-
106
-
107
-
108
-
109
-
110
-
111
-
112
-
113
-
114
-
115
-
116
-
117
-
118
-
119
-
120
-
121
-
122
-
123
-
124
-
125
-
126
-
127
-
128
-
129
-
130
-
131
-
132
-
133
-
134
-
135
-
136
-
137
-
138
-
139
-
140
-
141
-
142
-
143
-
144
-
145
-
146
-
147
-
148
-
149
-
150
-
151
-
152
-
153
-
154
-
155
-
156
-
157
-
158
-
159
-
160
-
161
-
162
-
163
-
164
 |
 |

50
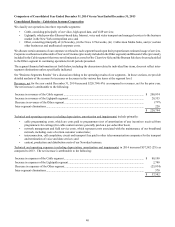
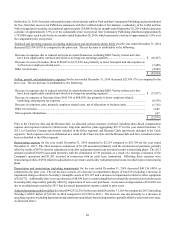
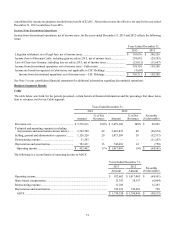
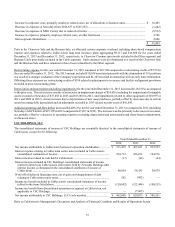
Adjusted operating cash flow decreased $52,122 (3%) for the year ended December 31, 2013 as compared to 2012. The net
decrease is attributable to the following:
Decrease in AOCF of the Cable segment .................................................................................................................... $ (58,512)
Increase in AOCF of the Lightpath segment................................................................................................................ 10,799
Decrease in AOCF of the Other segment..................................................................................................................... (4,409)
$ (52,122)
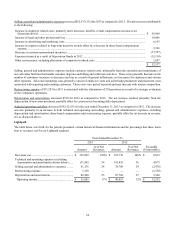
Interest expense, net decreased $59,437 (9%) for 2013 as compared to 2012. The net decrease is attributable to the following:
Decrease due to lower average interest rates on our indebtedness.............................................................................. $ (64,441)
Net increase due to change in average debt balances .................................................................................................. 3,819
Lower interest income.................................................................................................................................................. 513
Increase in fees related primarily to the refinancing of CSC Holdings' credit facility................................................ 7,848
Decrease in interest expense related to capital leases and lower amortization of deferred financing costs................ (7,176)
$ (59,437)
See "Liquidity and Capital Resources" discussion below for a detail of our borrower groups.
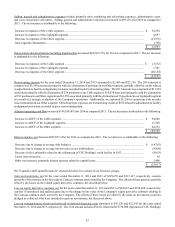
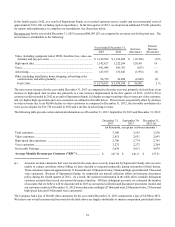
Gain on investments, net for the years ended December 31, 2013 and 2012 of $313,167 and $294,235, respectively, consists
primarily of the increase in the fair value of Comcast common stock owned by the Company. The effects of these gains are offset
by the losses on the related equity derivative contracts, net described below.
Loss on equity derivative contracts, net for the years ended December 31, 2013 and 2012 of $198,688 and $211,335, respectively,
consists of unrealized and realized gains due to the change in fair value of the Company's equity derivative contracts relating to
the Comcast common stock owned by the Company. The effects of these losses are offset by the gains on investment securities
pledged as collateral, which are included in gain on investments, net discussed above.
Loss on interest rate swap contracts, net amounted to $1,828 for the year ended December 31, 2012. Through their maturity on
June 30, 2012, CSC Holdings was party to several interest rate swap contracts with an aggregate notional amount of $2,600,000
that effectively fixed borrowing rates on a portion of the Company's floating rate debt. The losses on interest rate swap contracts
were a result of a shift in the yield curve over the life of the swap contracts.
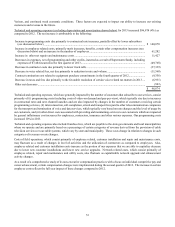
Loss on extinguishment of debt and write-off of deferred financing costs amounted to $22,542 and $66,213 for the years ended
December 31, 2013 and 2012, respectively. The 2013 amount represents payments in excess of the aggregate principal amount
to repurchase CSC Holdings senior notes due April 2014 and June 2015 and related fees and the write-off of unamortized deferred
financing costs and discounts related to such repurchases, net of a gain recognized in connection with the repurchase of Cablevision's
senior notes due September 2022. Additionally, the 2013 amount includes the write-off of deferred financing costs associated
with the refinancing of the Restricted Group credit facility. The 2012 amount represents payments in excess of the aggregate
principal amount to repurchase a portion of CSC Holdings' senior notes due April 2014 and June 2015 and related fees associated
with the tender offer and the write-off of unamortized deferred financing costs and discounts related to such repurchases.
Additionally, the 2012 amount includes the write-off of deferred financing costs associated with the refinancing of the Newsday
credit facility.
Income tax expense of $65,635 for the year ended December 31, 2013, reflected an effective tax rate of 34%. An increase in the
valuation allowance relating to certain state net operating loss carry forwards resulted in tax expense of $5,631. The Company
recorded tax benefits of (i) $3,739 related to research and development credits, (ii) $11,228 resulting from a change in the state
apportionment rates used to measure deferred taxes, and (iii) $3,851 resulting from a lower tax rate used to determine deferred tax
on unrealized investment gains. Absent these items, the effective tax rate for the year ended December 31, 2013 would have been
41%.
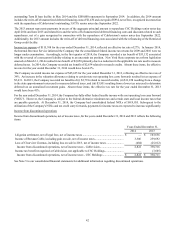
The Company recorded income tax expense of $51,994 for the year ended December 31, 2012, reflecting an effective tax rate of
41%. An increase in the valuation allowance relating to certain state net operating loss carry forwards resulted in tax expense of
$5,480. The Company recorded a tax benefit of $2,659 related to uncertain tax positions and $3,935 resulting from re-measuring
the deferred tax asset for certain state net operating loss carry forwards. The exclusion of pretax income of an entity that is not