Cablevision 2014 Annual Report Download - page 51
Download and view the complete annual report
Please find page 51 of the 2014 Cablevision annual report below. You can navigate through the pages in the report by either clicking on the pages listed below, or by using the keyword search tool below to find specific information within the annual report.-
 1
1 -
2
-
3
-
4
-
5
-
6
-
7
-
8
-
9
-
10
-
11
-
12
-
13
-
14
-
15
-
16
-
17
-
18
-
19
-
20
-
21
-
22
-
23
-
24
-
25
-
26
-
27
-
28
-
29
-
30
-
31
-
32
-
33
-
34
-
35
-
36
-
37
-
38
-
39
-
40
-
 41
41 -
 42
42 -
 43
43 -
 44
44 -
 45
45 -
 46
46 -
 47
47 -
 48
48 -
 49
49 -
 50
50 -
 51
51 -
 52
52 -
 53
53 -
 54
54 -
 55
55 -
 56
56 -
 57
57 -
 58
58 -
 59
59 -
 60
60 -
 61
61 -
62
-
63
-
64
-
65
-
66
-
67
-
68
-
69
-
70
-
71
-
72
-
73
-
74
-
75
-
76
-
77
-
78
-
79
-
80
-
81
-
82
-
83
-
84
-
85
-
86
-
87
-
88
-
89
-
90
-
91
-
92
-
93
-
94
-
95
-
96
-
97
-
98
-
99
-
100
-
101
-
102
-
103
-
104
-
105
-
106
-
107
-
108
-
109
-
110
-
111
-
112
-
113
-
114
-
115
-
116
-
117
-
118
-
119
-
120
-
121
-
122
-
123
-
124
-
125
-
126
-
127
-
128
-
129
-
130
-
131
-
132
-
133
-
134
-
135
-
136
-
137
-
138
-
139
-
140
-
141
-
142
-
143
-
144
-
145
-
146
-
147
-
148
-
149
-
150
-
151
-
152
-
153
-
154
-
155
-
156
-
157
-
158
-
159
-
160
-
161
-
162
-
163
-
164
 |
 |

45
number of customers receiving certain programming services, (ii) interconnection, call completion, circuit and transport fees paid
to other telecommunication companies for the transport and termination of voice and data services, which typically vary based on
rate changes and the level of usage by our customers, and (iii) other direct costs associated with providing and maintaining services
to our customers which are impacted by general cost increases for employees, contractors, insurance and other various expenses.
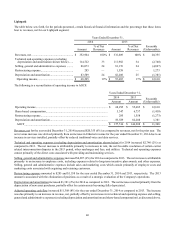
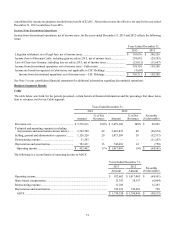
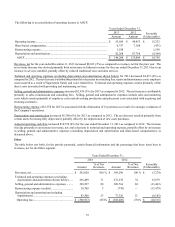
Our programming costs increased 6% in 2014 due primarily to an increase in contractual programming rates, partially offset by a
decrease in video customers. Our programming costs in 2015 will be impacted by changes in programming rates, which we expect
to increase by high single digits, and by changes in the number of video customers.
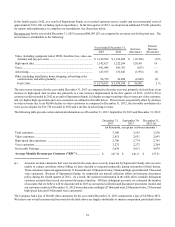
Technical and operating expenses also include franchise fees, which are payable to the state governments and local municipalities
where we operate and are primarily based on a percentage of certain categories of revenue derived from the provision of cable
television service over our cable systems, which vary by state and municipality. These costs change in relation to changes in such
categories of revenues or rate changes.
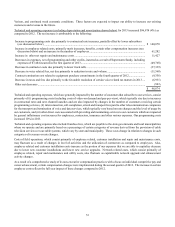
Costs of field operations, which consist primarily of employee related, customer installation and repair and maintenance costs,
may fluctuate as a result of changes in level of activities and the utilization of contractors as compared to employees. Also,
employee related and customer installation costs increase as the portion of our expenses that we are able to capitalize decrease
due to lower new customer installations and lower new service upgrades. Network related costs, which consist primarily of
employee related, repair and maintenance and utility costs, also fluctuate as capitalizable network upgrade and enhancement
activity changes.
We expect that our technical and operating expenses will continue to increase in the future.
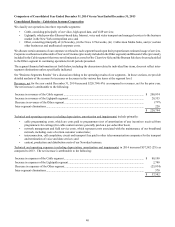
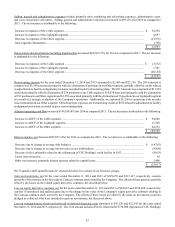
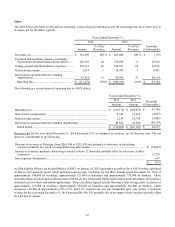
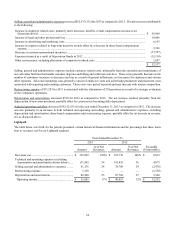
Selling, general and administrative expenses increased $32,230 (3%) for 2014 as compared to 2013. The net increase is attributable
to the following:
Increase in advertising and marketing costs................................................................................................................. $ 20,218
Increase in expenses related to long-term incentive awards, partially offset by a decrease in share-based
compensation expense .............................................................................................................................................. 11,381
Decrease in employee related costs related to the elimination of certain positions in 2013, partially offset by merit
and benefit increases................................................................................................................................................. (11,064)
Other net increases, which include certain costs related to advertising sales and billing transaction fees (net of
insurance recovery related to Superstorm Sandy of $922 in 2014).......................................................................... 11,695
$ 32,230
Selling, general and administrative expenses include customer related costs, principally from the operation and maintenance of
our call center facilities that handle customer inquiries and billing and collection activities. These costs rise as a result of general
cost increases for employees and various other expenses. Sales and marketing costs primarily consist of employee costs and
advertising production and placement costs associated with acquiring and retaining customers. These costs vary period to period
and may increase with intense competition.
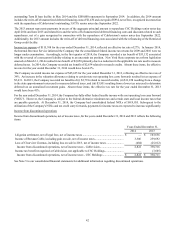
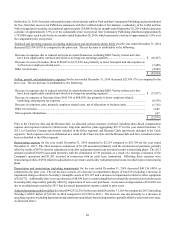
Depreciation and amortization decreased $3,872 (1%) for 2014 as compared to 2013. The net decrease resulted primarily from
certain assets becoming fully depreciated, partially offset by depreciation of new asset purchases.
Adjusted operating cash flow increased $94,048 (5%) for the year ended December 31, 2014 as compared to 2013. The increase
was due primarily to an increase in revenue, partially offset by an increase in both technical and operating and selling, general and
administrative expenses (excluding depreciation and amortization, restructuring expense (credits) and share-based compensation),
as discussed above.