Cablevision 2014 Annual Report Download - page 49
Download and view the complete annual report
Please find page 49 of the 2014 Cablevision annual report below. You can navigate through the pages in the report by either clicking on the pages listed below, or by using the keyword search tool below to find specific information within the annual report.-
 1
1 -
2
-
3
-
4
-
5
-
6
-
7
-
8
-
9
-
10
-
11
-
12
-
13
-
14
-
15
-
16
-
17
-
18
-
19
-
20
-
21
-
22
-
23
-
24
-
25
-
26
-
27
-
28
-
29
-
30
-
31
-
32
-
33
-
34
-
35
-
36
-
37
-
38
-
 39
39 -
 40
40 -
 41
41 -
 42
42 -
 43
43 -
 44
44 -
 45
45 -
 46
46 -
 47
47 -
 48
48 -
 49
49 -
 50
50 -
 51
51 -
 52
52 -
 53
53 -
 54
54 -
 55
55 -
 56
56 -
 57
57 -
 58
58 -
 59
59 -
60
-
61
-
62
-
63
-
64
-
65
-
66
-
67
-
68
-
69
-
70
-
71
-
72
-
73
-
74
-
75
-
76
-
77
-
78
-
79
-
80
-
81
-
82
-
83
-
84
-
85
-
86
-
87
-
88
-
89
-
90
-
91
-
92
-
93
-
94
-
95
-
96
-
97
-
98
-
99
-
100
-
101
-
102
-
103
-
104
-
105
-
106
-
107
-
108
-
109
-
110
-
111
-
112
-
113
-
114
-
115
-
116
-
117
-
118
-
119
-
120
-
121
-
122
-
123
-
124
-
125
-
126
-
127
-
128
-
129
-
130
-
131
-
132
-
133
-
134
-
135
-
136
-
137
-
138
-
139
-
140
-
141
-
142
-
143
-
144
-
145
-
146
-
147
-
148
-
149
-
150
-
151
-
152
-
153
-
154
-
155
-
156
-
157
-
158
-
159
-
160
-
161
-
162
-
163
-
164
 |
 |

43
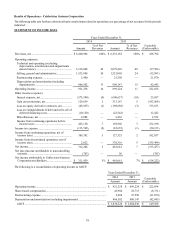
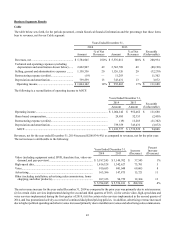
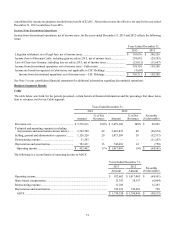
Business Segments Results
Cable
The table below sets forth, for the periods presented, certain historical financial information and the percentage that those items
bear to revenues, net for our Cable segment:
Years Ended December 31,
2014 2013
Amount % of Net
Revenues Amount % of Net
Revenues Favorable
(Unfavorable)
Revenues, net .......................................................... $ 5,784,945 100% $ 5,576,011 100% $ 208,934
Technical and operating expenses (excluding
depreciation and amortization shown below)...... 2,822,907 49 2,742,709 49 (80,198)
Selling, general and administrative expenses ......... 1,158,356 20 1,126,126 20 (32,230)
Restructuring expense (credits)............................... (19) — 11,283 — 11,302
Depreciation and amortization................................ 739,559 13 743,431 13 3,872
Operating income.................................................. $ 1,064,142 18% $ 952,462 17% $ 111,680
The following is a reconciliation of operating income to AOCF:
Years Ended December 31,
2014 2013 Favorable
(Unfavorable)
Amount Amount
Operating income.................................................................................................... $ 1,064,142 $ 952,462 $ 111,680
Share-based compensation...................................................................................... 29,895 32,353 (2,458)
Restructuring expense (credits)............................................................................... (19) 11,283 (11,302)
Depreciation and amortization................................................................................ 739,559 743,431 (3,872)
AOCF.................................................................................................................... $ 1,833,577 $ 1,739,529 $ 94,048
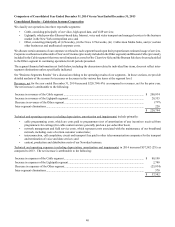
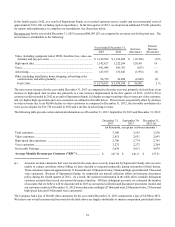
Revenues, net for the year ended December 31, 2014 increased $208,934 (4%) as compared to revenues, net for the prior year.
The net increase is attributable to the following:
Years Ended December 31, Increase
(Decrease)
Percent
Increase
(Decrease)
2014 2013
Video (including equipment rental, DVR, franchise fees, video-on-
demand, and pay-per-view) ............................................................ $ 3,187,245 $ 3,149,702 $ 37,543 1%
High-speed data.................................................................................. 1,416,328 1,342,627 73,701 5
Voice................................................................................................... 910,653 841,048 69,605 8
Advertising......................................................................................... 163,596 147,875 15,721 11
Other (including installation, advertising sales commissions, home
shopping, and other products)......................................................... 107,123 94,759 12,364 13
$ 5,784,945 $ 5,576,011 $ 208,934 4%
The net revenue increase for the year ended December 31, 2014 as compared to the prior year was primarily due to rate increases:
(i) for certain video services implemented during the second and third quarters of 2013, (ii) for certain video, high-speed data and
voice services implemented during the first quarter of 2014, (iii) for certain video services implemented in the second quarter of
2014, and less promotional activity as a result of continued disciplined pricing policies. In addition, advertising revenue increased
due to higher political spending and other revenue increased primarily due to installation revenue and advertising sales commissions.