Cablevision 2014 Annual Report Download - page 101
Download and view the complete annual report
Please find page 101 of the 2014 Cablevision annual report below. You can navigate through the pages in the report by either clicking on the pages listed below, or by using the keyword search tool below to find specific information within the annual report.-
 1
1 -
2
-
3
-
4
-
5
-
6
-
7
-
8
-
9
-
10
-
11
-
12
-
13
-
14
-
15
-
16
-
17
-
18
-
19
-
20
-
21
-
22
-
23
-
24
-
25
-
26
-
27
-
28
-
29
-
30
-
31
-
32
-
33
-
34
-
35
-
36
-
37
-
38
-
39
-
40
-
41
-
42
-
43
-
44
-
45
-
46
-
47
-
48
-
49
-
50
-
51
-
52
-
53
-
54
-
55
-
56
-
57
-
58
-
59
-
60
-
61
-
62
-
63
-
64
-
65
-
66
-
67
-
68
-
69
-
70
-
71
-
72
-
73
-
74
-
75
-
76
-
77
-
78
-
79
-
80
-
81
-
82
-
83
-
84
-
85
-
86
-
87
-
88
-
89
-
90
-
 91
91 -
 92
92 -
 93
93 -
 94
94 -
 95
95 -
 96
96 -
 97
97 -
 98
98 -
 99
99 -
 100
100 -
 101
101 -
 102
102 -
 103
103 -
 104
104 -
 105
105 -
 106
106 -
 107
107 -
 108
108 -
 109
109 -
 110
110 -
 111
111 -
112
-
113
-
114
-
115
-
116
-
117
-
118
-
119
-
120
-
121
-
122
-
123
-
124
-
125
-
126
-
127
-
128
-
129
-
130
-
131
-
132
-
133
-
134
-
135
-
136
-
137
-
138
-
139
-
140
-
141
-
142
-
143
-
144
-
145
-
146
-
147
-
148
-
149
-
150
-
151
-
152
-
153
-
154
-
155
-
156
-
157
-
158
-
159
-
160
-
161
-
162
-
163
-
164
 |
 |

F-12
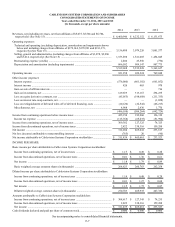
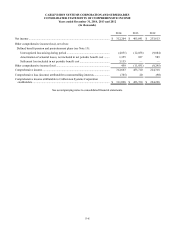
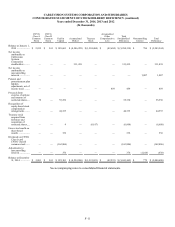
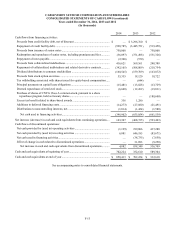
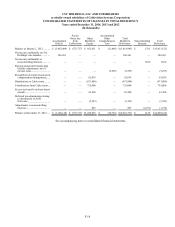
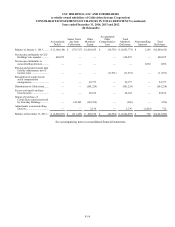
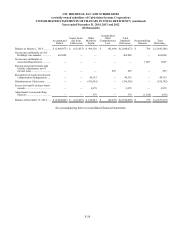
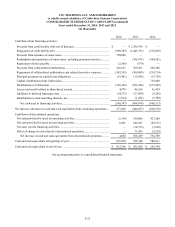
CABLEVISION SYSTEMS CORPORATION AND SUBSIDIARIES
CONSOLIDATED STATEMENTS OF CASH FLOWS
Years ended December 31, 2014, 2013 and 2012
(In thousands)
2014 2013 2012
Cash flows from operating activities:
Net Income............................................................................................................... $ 312,204 $ 465,641 $ 233,613
Adjustments to reconcile net income to net cash provided by operating
activities:
Income from discontinued operations, net of income taxes ............................. (2,822)(338,316)(159,288)
Depreciation and amortization (including impairments).................................. 866,502 909,147 907,775
Gain on sale of affiliate interests ...................................................................... — — (716)
Gain on investments, net................................................................................... (129,659)(313,167)(294,235)
Loss on equity derivative contracts, net ........................................................... 45,055 198,688 211,335
Loss on extinguishment of debt and write-off of deferred financing costs...... 10,120 22,542 66,213
Amortization of deferred financing costs and discounts on indebtedness........ 22,887 25,936 36,106
Share-based compensation expense related to equity classified awards .......... 43,984 52,715 60,646
Settlement loss and amortization of actuarial losses related to pension and
postretirement plans...................................................................................... 7,643 1,575 997
Deferred income taxes...................................................................................... 159,779 69,456 42,330
Provision for doubtful accounts........................................................................ 47,611 55,231 49,002
Excess tax benefits related to share-based awards ........................................... (336)(1,280) —
Change in assets and liabilities, net of effects of acquisitions and dispositions:
Accounts receivable, trade .................................................................................. (42,446)(25,673)(76,955)
Other receivables................................................................................................. 16,685 (6,465)(10,489)
Prepaid expenses and other assets....................................................................... 27,803 (2,176) 47,560
Advances/payables to affiliates........................................................................... (1,463)(1,637) 12,970
Accounts payable................................................................................................ 25,486 (1,715) 16,172
Accrued liabilities ............................................................................................... (35,931) 33,982 (26,443)
Deferred revenue................................................................................................. 5,169 (9,507)(2)
Liabilities related to interest rate swap contracts................................................ — — (55,383)
Net cash provided by operating activities................................................................ 1,378,271 1,134,977 1,061,208
Cash flows from investing activities:
Capital expenditures................................................................................................. (891,678)(951,679)(991,586)
Proceeds related to sale of equipment, including costs of disposal......................... 6,178 7,884 364
Proceeds from sale of affiliate interests................................................................... — — 750
Decrease (increase) in other investments................................................................. (1,369)(1,178) 955
Decrease in restricted cash....................................................................................... — — 1,149
Additions to other intangible assets......................................................................... (1,193)(3,685)(4,704)
Net cash used in investing activities ................................................................... (888,062)(948,658)(993,072)