Cablevision 2014 Annual Report Download - page 44
Download and view the complete annual report
Please find page 44 of the 2014 Cablevision annual report below. You can navigate through the pages in the report by either clicking on the pages listed below, or by using the keyword search tool below to find specific information within the annual report.-
 1
1 -
2
-
3
-
4
-
5
-
6
-
7
-
8
-
9
-
10
-
11
-
12
-
13
-
14
-
15
-
16
-
17
-
18
-
19
-
20
-
21
-
22
-
23
-
24
-
25
-
26
-
27
-
28
-
29
-
30
-
31
-
32
-
33
-
 34
34 -
 35
35 -
 36
36 -
 37
37 -
 38
38 -
 39
39 -
 40
40 -
 41
41 -
 42
42 -
 43
43 -
 44
44 -
 45
45 -
 46
46 -
 47
47 -
 48
48 -
 49
49 -
 50
50 -
 51
51 -
 52
52 -
 53
53 -
 54
54 -
55
-
56
-
57
-
58
-
59
-
60
-
61
-
62
-
63
-
64
-
65
-
66
-
67
-
68
-
69
-
70
-
71
-
72
-
73
-
74
-
75
-
76
-
77
-
78
-
79
-
80
-
81
-
82
-
83
-
84
-
85
-
86
-
87
-
88
-
89
-
90
-
91
-
92
-
93
-
94
-
95
-
96
-
97
-
98
-
99
-
100
-
101
-
102
-
103
-
104
-
105
-
106
-
107
-
108
-
109
-
110
-
111
-
112
-
113
-
114
-
115
-
116
-
117
-
118
-
119
-
120
-
121
-
122
-
123
-
124
-
125
-
126
-
127
-
128
-
129
-
130
-
131
-
132
-
133
-
134
-
135
-
136
-
137
-
138
-
139
-
140
-
141
-
142
-
143
-
144
-
145
-
146
-
147
-
148
-
149
-
150
-
151
-
152
-
153
-
154
-
155
-
156
-
157
-
158
-
159
-
160
-
161
-
162
-
163
-
164
 |
 |

38
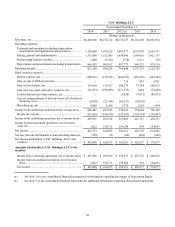
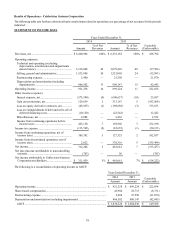
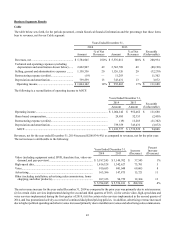
Results of Operations - Cablevision Systems Corporation
The following table sets forth on a historical basis certain items related to operations as a percentage of net revenues for the periods
indicated:
STATEMENT OF INCOME DATA
Years Ended December 31,
2014 2013
Amount % of Net
Revenues Amount % of Net
Revenues Favorable
(Unfavorable)
Revenues, net......................................................... $ 6,460,946 100% $ 6,232,152 100% $ 228,794
Operating expenses:
Technical and operating (excluding
depreciation, amortization and impairments
shown below)................................................... 3,136,808 49 3,079,226 49 (57,582)
Selling, general and administrative..................... 1,533,898 24 1,521,005 24 (12,893)
Restructuring expense......................................... 2,480 — 23,550 — 21,070
Depreciation and amortization (including
impairments).................................................... 866,502 13 909,147 15 42,645
Operating income .................................................. 921,258 14 699,224 11 222,034
Other income (expense):
Interest expense, net............................................ (575,580)(9)(600,637)(10) 25,057
Gain on investments, net..................................... 129,659 2 313,167 5 (183,508)
Loss on equity derivative contracts, net.............. (45,055)(1)(198,688)(3) 153,633
Loss on extinguishment of debt and write-off of
deferred financing costs................................... (10,120) — (22,542) — 12,422
Miscellaneous, net............................................... 4,988 — 2,436 — 2,552
Income from continuing operations before
income taxes.................................................... 425,150 7 192,960 3 232,190
Income tax expense ............................................... (115,768)(2)(65,635)(1)(50,133)
Income from continuing operations, net of
income taxes....................................................... 309,382 5 127,325 2 182,057
Income from discontinued operations, net of
income taxes....................................................... 2,822 — 338,316 5 (335,494)
Net income............................................................. 312,204 5 465,641 7 (153,437)
Net loss (income) attributable to noncontrolling
interests .............................................................. (765) — 20 — (785)
Net income attributable to Cablevision Systems
Corporation stockholders................................... $ 311,439 5% $ 465,661 7% $ (154,222)
The following is a reconciliation of operating income to AOCF:
Years Ended December 31,
2014 2013 Favorable
(Unfavorable)
Amount Amount
Operating income .................................................................................................. $ 921,258 $ 699,224 $ 222,034
Share-based compensation .................................................................................... 43,984 52,715 (8,731)
Restructuring expense ........................................................................................... 2,480 23,550 (21,070)
Depreciation and amortization (including impairments)....................................... 866,502 909,147 (42,645)
AOCF.................................................................................................................. $ 1,834,224 $ 1,684,636 $ 149,588