Burger King 2010 Annual Report Download - page 99
Download and view the complete annual report
Please find page 99 of the 2010 Burger King annual report below. You can navigate through the pages in the report by either clicking on the pages listed below, or by using the keyword search tool below to find specific information within the annual report.-
 1
1 -
2
-
3
-
4
-
5
-
6
-
7
-
8
-
9
-
10
-
11
-
12
-
13
-
14
-
15
-
16
-
17
-
18
-
19
-
20
-
21
-
22
-
23
-
24
-
25
-
26
-
27
-
28
-
29
-
30
-
31
-
32
-
33
-
34
-
35
-
36
-
37
-
38
-
39
-
40
-
41
-
42
-
43
-
44
-
45
-
46
-
47
-
48
-
49
-
50
-
51
-
52
-
53
-
54
-
55
-
56
-
57
-
58
-
59
-
60
-
61
-
62
-
63
-
64
-
65
-
66
-
67
-
68
-
69
-
70
-
71
-
72
-
73
-
74
-
75
-
76
-
77
-
78
-
79
-
80
-
81
-
82
-
83
-
84
-
85
-
86
-
87
-
88
-
 89
89 -
 90
90 -
 91
91 -
 92
92 -
 93
93 -
 94
94 -
 95
95 -
 96
96 -
 97
97 -
 98
98 -
 99
99 -
 100
100 -
 101
101 -
 102
102 -
 103
103 -
 104
104 -
 105
105 -
 106
106 -
 107
107 -
 108
108 -
 109
109 -
110
-
111
-
112
-
113
-
114
-
115
-
116
-
117
-
118
-
119
-
120
-
121
-
122
-
123
-
124
-
125
-
126
-
127
-
128
-
129
-
130
-
131
-
132
-
133
-
134
-
135
-
136
-
137
-
138
-
139
-
140
-
141
-
142
-
143
-
144
-
145
-
146
 |
 |

Table of Contents
BURGER KING HOLDINGS, INC. AND SUBSIDIARIES
Notes to Consolidated Financial Statements — (Continued)
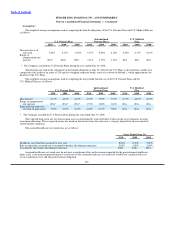
Note 16. Income Taxes
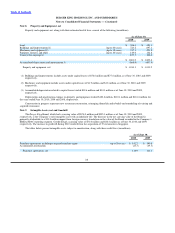
Income before income taxes, classified by source of income, is as follows (in millions):
Years Ended June 30,
2010 2009 2008
Domestic $ 228.4 $ 241.4 $ 245.1
Foreign 55.9 43.4 47.9
Income before income taxes $ 284.3 $ 284.8 $ 293.0
Income tax expense (benefit) attributable to income from continuing operations consists of the following (in millions):
Years Ended June 30,
2010 2009 2008
Current:
Domestic
Federal $ 64.7 $ 57.0 $ 64.5
State, net of federal income tax benefit 4.6 6.1 8.3
Foreign 11.3 9.5 10.3
$ 80.6 $ 72.6 $ 83.1
Deferred:
Domestic
Federal $ 14.4 $ 9.1 $ 9.8
State, net of federal income tax benefit 3.1 6.2 1.3
Foreign (0.6) (3.2) 9.2
$ 16.9 $ 12.1 $ 20.3
Total $ 97.5 $ 84.7 $ 103.4
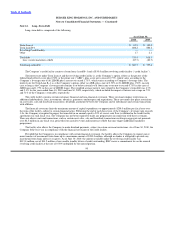
The U.S. Federal tax statutory rate reconciles to the effective tax rate as follows:
Years Ended June 30,
2010 2009 2008
U.S. Federal income tax rate 35.0% 35.0% 35.0%
State income taxes, net of federal income tax benefit 3.4 2.8 2.6
Costs/(Benefits) and taxes related to foreign operations 1.7 (4.7) 7.4
Foreign tax rate differential (5.6) (4.9) (5.3)
Foreign exchange differential on tax benefits 0.3 0.7 (0.6)
Change in valuation allowance (0.6) 1.1 (3.1)
Change in accrual for tax uncertainties 0.2 (1.3) (0.1)
Other (0.1) 1.0 (0.6)
Effective income tax rate 34.3% 29.7% 35.3%
The Company’s effective tax rate was 34.3% for the fiscal year ended June 30, 2010, primarily as a result of the current mix of
income from multiple tax jurisdictions and currency fluctuations. The Company’s effective tax rate was 29.7% for the fiscal year ended
June 30, 2009, primarily as a result of the resolution of federal and state audits
96