Burger King 2010 Annual Report Download - page 101
Download and view the complete annual report
Please find page 101 of the 2010 Burger King annual report below. You can navigate through the pages in the report by either clicking on the pages listed below, or by using the keyword search tool below to find specific information within the annual report.-
 1
1 -
2
-
3
-
4
-
5
-
6
-
7
-
8
-
9
-
10
-
11
-
12
-
13
-
14
-
15
-
16
-
17
-
18
-
19
-
20
-
21
-
22
-
23
-
24
-
25
-
26
-
27
-
28
-
29
-
30
-
31
-
32
-
33
-
34
-
35
-
36
-
37
-
38
-
39
-
40
-
41
-
42
-
43
-
44
-
45
-
46
-
47
-
48
-
49
-
50
-
51
-
52
-
53
-
54
-
55
-
56
-
57
-
58
-
59
-
60
-
61
-
62
-
63
-
64
-
65
-
66
-
67
-
68
-
69
-
70
-
71
-
72
-
73
-
74
-
75
-
76
-
77
-
78
-
79
-
80
-
81
-
82
-
83
-
84
-
85
-
86
-
87
-
88
-
89
-
90
-
 91
91 -
 92
92 -
 93
93 -
 94
94 -
 95
95 -
 96
96 -
 97
97 -
 98
98 -
 99
99 -
 100
100 -
 101
101 -
 102
102 -
 103
103 -
 104
104 -
 105
105 -
 106
106 -
 107
107 -
 108
108 -
 109
109 -
 110
110 -
 111
111 -
112
-
113
-
114
-
115
-
116
-
117
-
118
-
119
-
120
-
121
-
122
-
123
-
124
-
125
-
126
-
127
-
128
-
129
-
130
-
131
-
132
-
133
-
134
-
135
-
136
-
137
-
138
-
139
-
140
-
141
-
142
-
143
-
144
-
145
-
146
 |
 |

Table of Contents
BURGER KING HOLDINGS, INC. AND SUBSIDIARIES
Notes to Consolidated Financial Statements — (Continued)
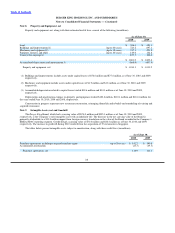
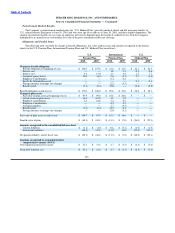
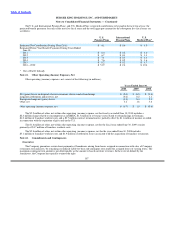
The tax effects of temporary differences that give rise to significant portions of the deferred tax assets and deferred tax liabilities
are presented below (in millions):
As of June 30,
2010 2009
Deferred tax assets:
Trade and notes receivable, principally due to allowance for doubtful accounts $ 14.6 $ 12.7
Accrued employee benefits 63.8 49.6
Unfavorable leases 53.9 71.9
Liabilities not currently deductible for tax 42.2 52.7
Tax loss and credit carryforwards 138.5 111.3
Property and equipment, principally due to differences in depreciation 53.0 61.6
Other 3.4 3.4
Total gross deferred tax assets 369.4 363.2
Valuation allowance (74.6) (78.7)
Net deferred tax assets 294.8 284.5
Less deferred tax liabilities:
Intangible assets 249.7 237.3
Leases 53.1 55.1
Statutory impairment 12.2 —
Total gross deferred tax liabilities 315.0 292.4
Net deferred tax liability $ 20.2 $ 7.9
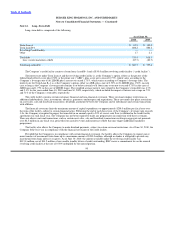
For the year ended June 30, 2010, the valuation allowance decreased by $4.1 million. The decrease in valuation allowance for the
year ended June 30, 2010 is primarily the result of changes in the projected utilization of deferred tax assets in foreign jurisdictions and
changes in currency exchange rates.
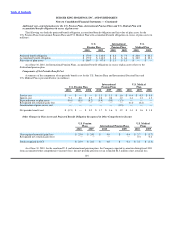
Changes in valuation allowance are as follows:
Years Ended June 30,
2010 2009 2008
Beginning balance $ 78.7 $ 87.9 $ 97.8
Change in estimates recorded to deferred income tax expense (1.7) 3.0 (7.1)
Change in estimates in valuation allowance recorded to intangible assets — (0.3) (6.5)
Changes from foreign currency exchange rates (3.1) (11.9) 4.6
Other 0.7 — (0.9)
Ending balance $ 74.6 $ 78.7 $ 87.9
The Company has no Federal loss carryforwards in the United States and has State loss carryforwards of $0.2 million, expiring
between 2022 and 2026. In addition, the Company has foreign loss carryforwards of $298.0 million expiring between 2011 and 2030,
and foreign loss carryforwards of $229.8 million that do not expire. As of June 30, 2010, the Company has a foreign tax credit
carryforward balance of $50.8 million.
Deferred taxes have not been provided on basis differences related to investments in foreign subsidiaries. These differences
consist primarily of $147.3 million of undistributed earnings, which are considered to be permanently reinvested in the operations of
such subsidiaries outside the United States. Determination of the
98